


BTC/USD Price Technical Analysis
BTC/USD – Slower Recovery
Last week, Bitcoin printed its highest level in three weeks at $7.241 and retreated after. Yet, the price remained above $6500 threshold then closed in the green with nearly 0.4% gain.
The Relative Strength Index (RSI) crossed above 50. However, the oscillator remained flat, signaling lack of impulse of uptrend move.
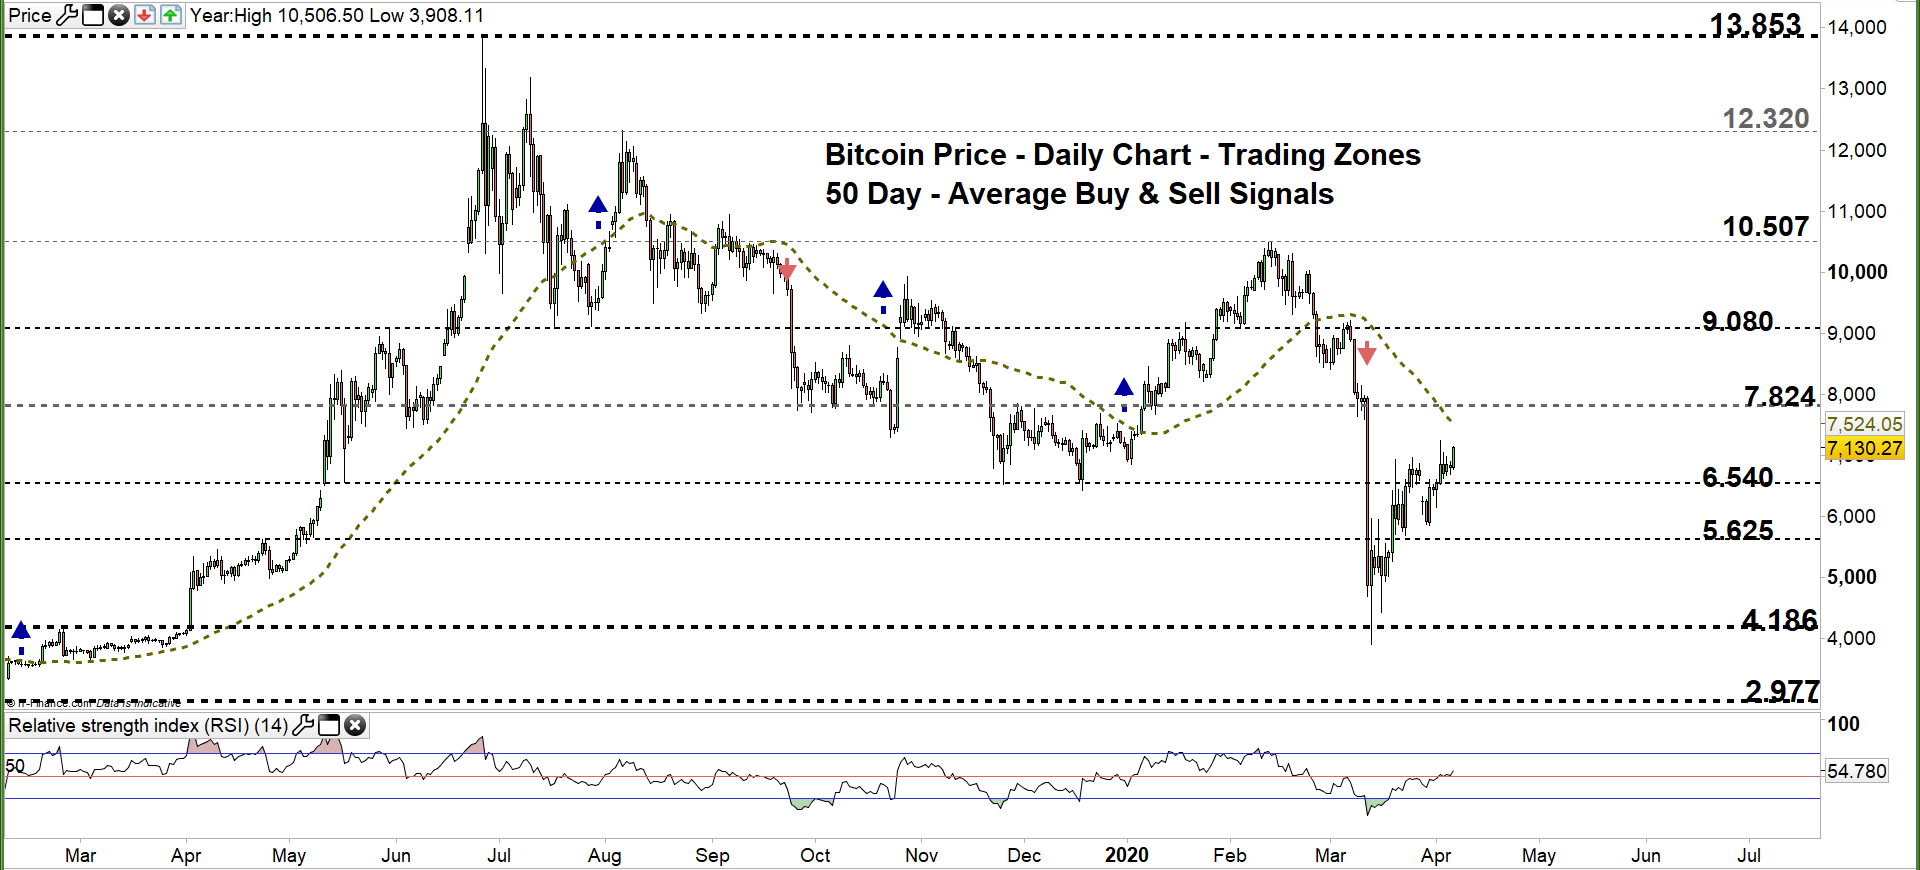
Bitcoin PRICE DAILY CHART (FEB 15 – April 6, 2020) Zoomed Out

Bitcoin PRICE DAILY CHART (JAN 15 – April 6, 2020) Zoomed In

Looking at the daily chart, we noticed that on March 23 BTC/USD started uptrend move creating higher highs with higher lows. On Thursday BTC/USD climbed to current trading zone $6.540 - $7.824 eyeing a test of the 50-day average.
A close above the high end of the zone may encourage bulls to push towards $9.080. Further close above that level could mean more bullishness towards $10.507. In that scenario, the weekly resistance levels underlined on the chart (zoomed in) should be watched closely.
On the other hand, any close below the low end of the zone could lead Bitcoin towards $5.625. Further close below that level could send BTC/USD even lower towards $4.186. Having said that, the daily and weekly support levels marked on the chart would be worth monitoring.

Bitcoin PRICE FOUR Hour CHART (Mar 15 – April 6, 2020)
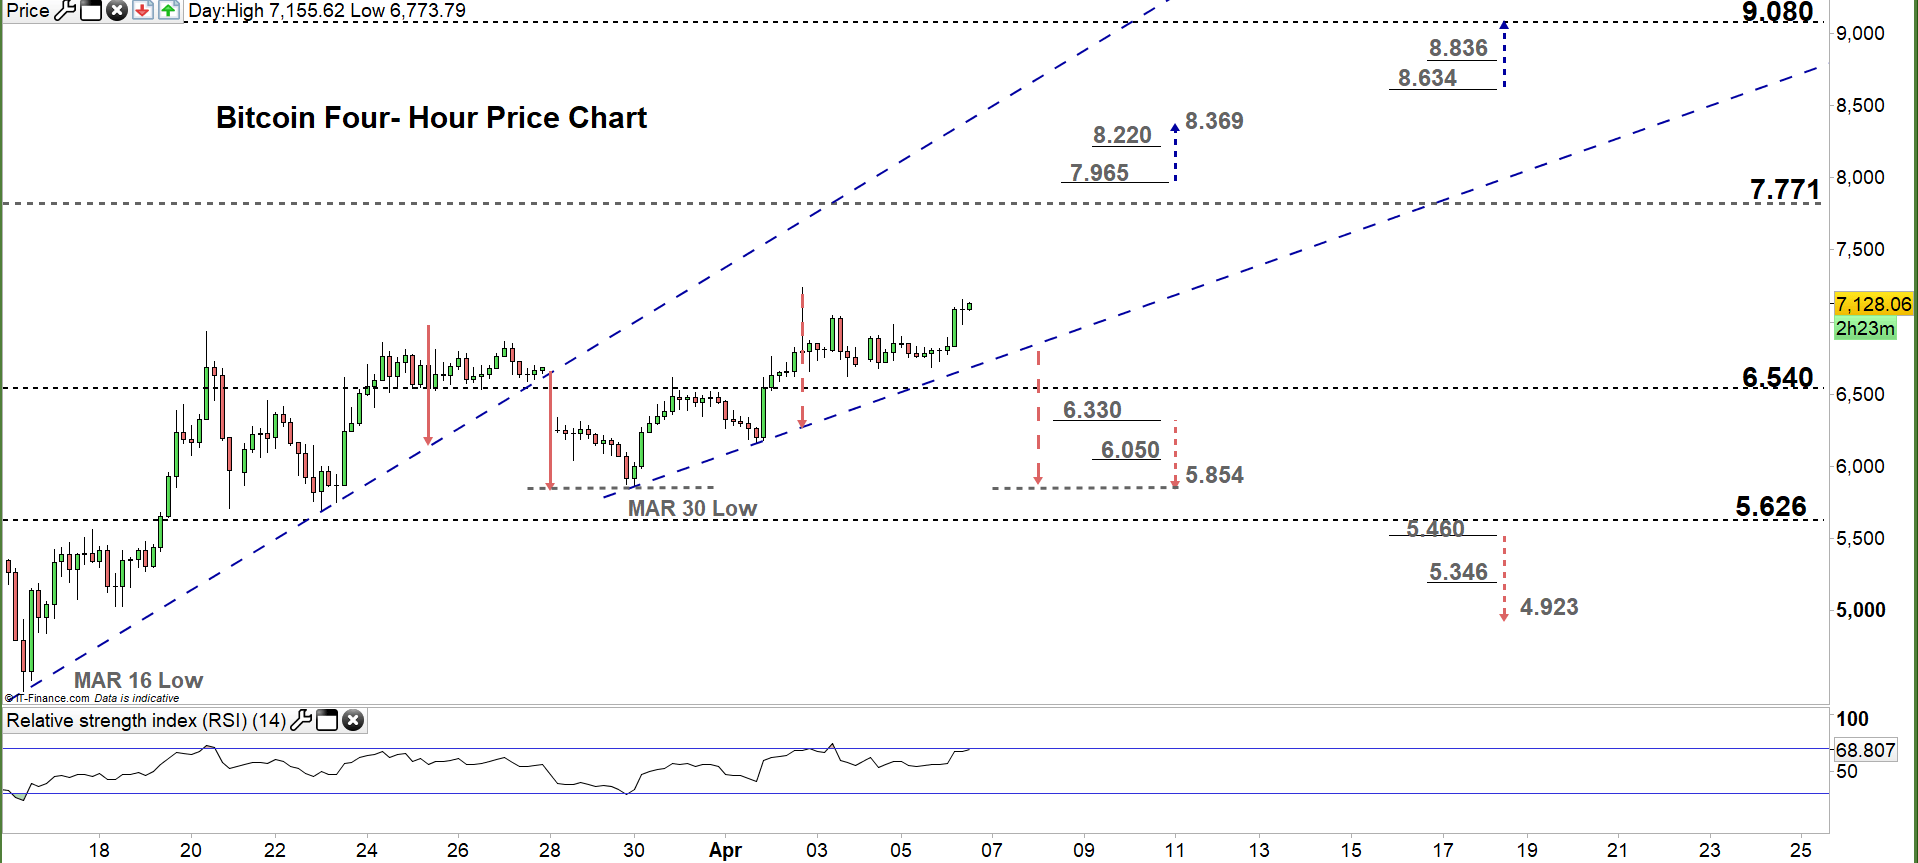
Looking at the four-hour chart, we noticed that on March 28 Bitcoin opened with a downside gap and broke below the uptrend line originated from the March 16 low at $4.435. Two days later, the price rebounded from the March 30 low at $5.854. Currently, the market trades above the uptrend line originated from the aforementioned March 30 low. Any violation to this line would be considered a bearish signal.
A break below $6.330 generates another bearish signal. This increases the likelihood for BTC/USD to test the March 30 low. Although, the daily support level underscored on the chart should be kept in focus. In turn, any break in the other direction, i.e. above $7.965 may cause a rally towards $8.369. Yet, the weekly resistance level printed on the chart should be considered.
See the chart to know more about the critical levels in a further bearish/ bullish move.
Written By: Mahmoud Alkudsi
Please feel free to contact me on Twitter: @Malkudsi


