


US Dollar, EUR/USD, AUD/USD, Trader Positioning - Talking Points
- US Dollar may rise as global outlook uncertainty boosts haven demand
- Sentiment hints that the EUR/USD and AUD/USD downtrend may go on
- Near-term gains may be tamed by outer layers of falling resistance ahead
What Does Trader Positioning Say About the US Dollar Price Trend?
In the recording above, I discussed the outlook for the US Dollar incorporating IG Client Sentiment (IGCS). This is a tool that can offer insight on prevailing market trends based on trader positioning. This is in addition to fundamental and technical analysis. Regarding the former, the Greenback may see gains due to heightened demand for liquidity and preserving capital amid the coronavirus outbreak that is sinking stocks worldwide.
Taking a brief look at my majors-based US Dollar index – which averages USD against EUR, JPY, GBP and AUD – the Greenback remains in an aggressive uptrend. Using the 4-hour chart below, gains are being maintained by “inner” and “outer” support. Taking out the former may not necessarily spell the end of USD’s appreciation. Rather, it could place the focus on the latter which may keep the uptrend intact down the road.
Majors-Based US Dollar Index - 4-Hour Chart
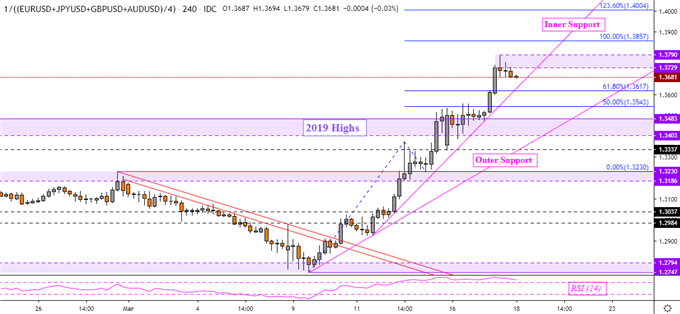
USD Index Chart Created in Trading View
Euro Sentiment Outlook
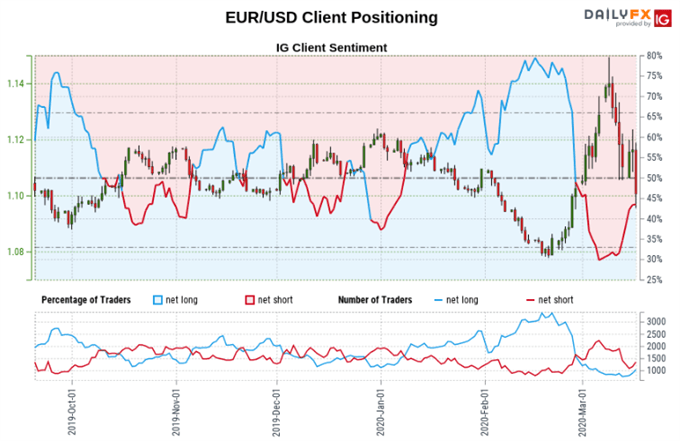
According to IG Client Sentiment at the time of writing, about 49.26% of traders are net long EUR/USD. This is up from about a 30% upside bias from earlier this month. Since then, the Euro has dropped over 4.2% against the US Dollar. That likely spoke to a greater share of traders attempting to pick the turning point.
We typically take a contrarian view to crowd sentiment, and the fact traders are netshort suggests the pair may rise.Yet traders are less netshort than yesterday and compared with last week. Recent changes in sentiment warn that the current trend may soon reverse lower despite the fact traders remain netshort.

Euro Technical Analysis
EUR/USD remains in a downtrend off peaks from earlier this month. Losses are being maintained by falling resistance – blue line on the chart below. Prices appear to be bouncing off lows from November which makes for a range of support between 1.0981 to 1.1003. That may pave the way for a retest of falling resistance. Down the road, the pair may struggle pushing through former falling resistance from December – red lines. Clearing this point opens the door to revisiting lows from February.
EUR/USD 4-Hour Chart
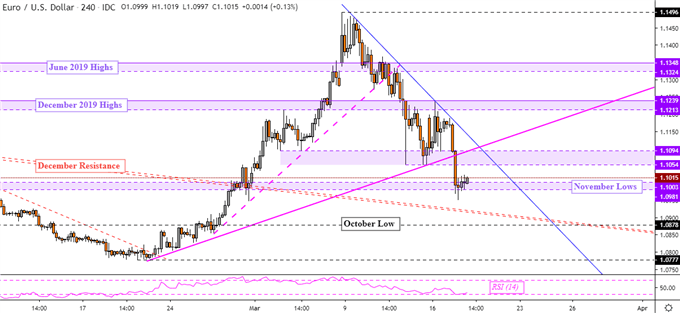
EUR/USD Chart Created in Trading View
Australian Dollar Sentiment Outlook
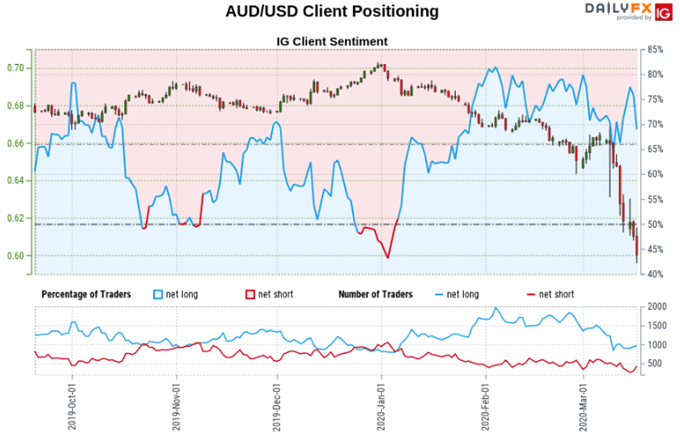
IGCS shows that about 71.93% of traders are net long AUD/USD. Those biased to the upside have climbed 17.86% and 14.99% from yesterday and last week respectively. We typically take a contrarian view to crowd sentiment, and the fact traders are netlong suggests the Australian Dollar may continue falling. The combination of current sentiment and recent changes offers a stronger bearish contrarian trading outlook.
Australian Dollar Technical Analysis
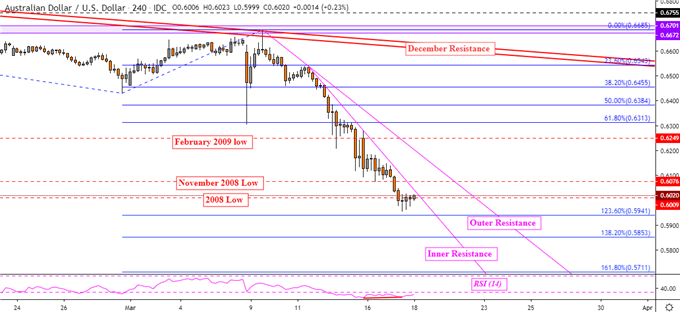
Positive RSI divergence is present on the AUD/USD 4-hour chart, hinting that a near-term bounce may be in store as downside momentum fades. If that pushes prices above “inner resistance” on the chart below, it could lead to a test of “outer resistance”. The latter may maintain the dominant downtrend. Otherwise, resuming losses through the 2008 bottom exposes the 123.6% Fibonacci extension at 0.5941.
AUD/USD Daily Chart
AUD/USD Chart Created in Trading View
*IG Client Sentiment Charts and Positioning Data Used from March 17 Report
--- Written by Daniel Dubrovsky, Currency Analyst for DailyFX.com
To contact Daniel, use the comments section below or @ddubrovskyFX on Twitter


