


Natural Gas Technical Outlook
- Natural gas trades in a sideways move
- Levels and signals to keep in focus
Natural Gas – Indecisive Traders
Last week, natural gas rallied to $1.857 then retreated and closed the weekly candlestick with a Doji pattern, indicating the market’s indecision at this stage.
This week, the Relative Strength Index (RSI) crossed above 50 hightailing the end of downtrend move.
Nat-Gas DAILY Price CHART (DEC 23, 2018 – Mar 12, 2020) Zoomed Out


Natural Gas DAILY Price CHART (DEc 5 – Mar 12, 2020) Zoomed IN
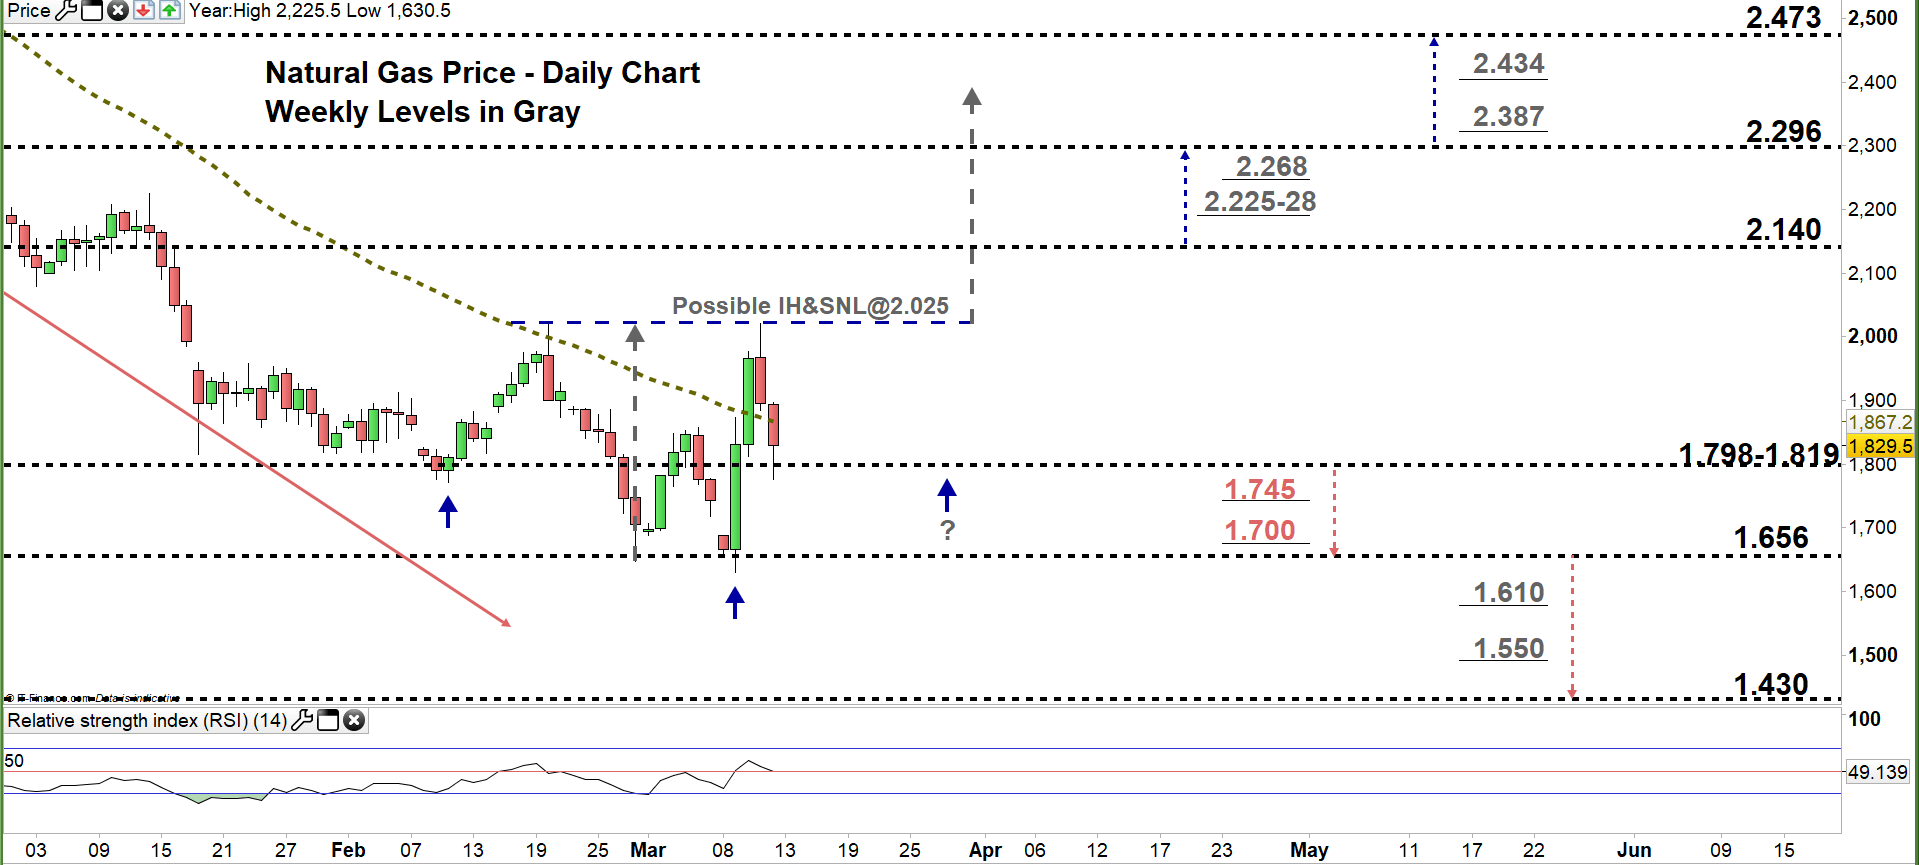
Looking at the daily chart, we noticed that at the start of the week natural gas rebounded from its lowest in over eleven years at $1,630 , then rallied as some bears seemed to cut back. Additionally, the price moved to a higher trading zone $1.819 – $2.140. In the following day, the market closed above the 50-day average generating a bullish signal.
Today, natural gas tested the low end of the zone. A close below this level could send the market towards $1.656. Further close above this level might encourage bears to press towards $1.430. That said, the daily and weekly support levels underlined on the chart should be considered.
It’s worth noting that, natural gas develops a possible inverted head and shoulders pattern where the neck line resides at $2.024. If the price breaks and remains above the neckline it could rally towards $2.434.
On the other hand, any failure in closing below the low end reflects bear’s hesitation. This could cause a rally towards the high end of the zone. Further close above this level opens the door for more bullishness towards $2.296. Yet, the weekly resistance levels and area marked on the chart should be kept in focus.

Natural Gas price Four-Hour PRICE CHART (DEC 29 – Mar 12, 2020)

From the four- hour chart, we noticed that on March 4 natural gas corrected its downtrend move as created a higher low at $1.794. Any violation to the Feb 20 high at 2.224 could trigger uptrend move.
Thus, break above $2.162 may cause a rally towards $2.267. Although, the weekly resistance level underscored on the chart should be monitored. In turn, any break below $1.610 may resume bearish price action towards $1.430.
See the chart to find out more about key levels the price would encounter in a further bearish/bullish move.
Written By: Mahmoud Alkudsi
Please feel free to contact me on Twitter: @Malkudsi


