


Natural Gas Technical Outlook
- Bears show more sway, yet still in control
- Natural gas could rally further as support holds
Natural Gas – Bears Ease Up
On Friday, natural gas tumbled to $1.646 – its lowest level in nearly four years. The price rallied after, as some bears seemed to cover. Yet, the weekly candlestick closed 10.8% loss. This week, more bears have eased up allowing the price to rally further.
Alongside that, the Relative Strength Index (RSI) pointed higher from 30 to 47 highlighting weaker downtrend move.
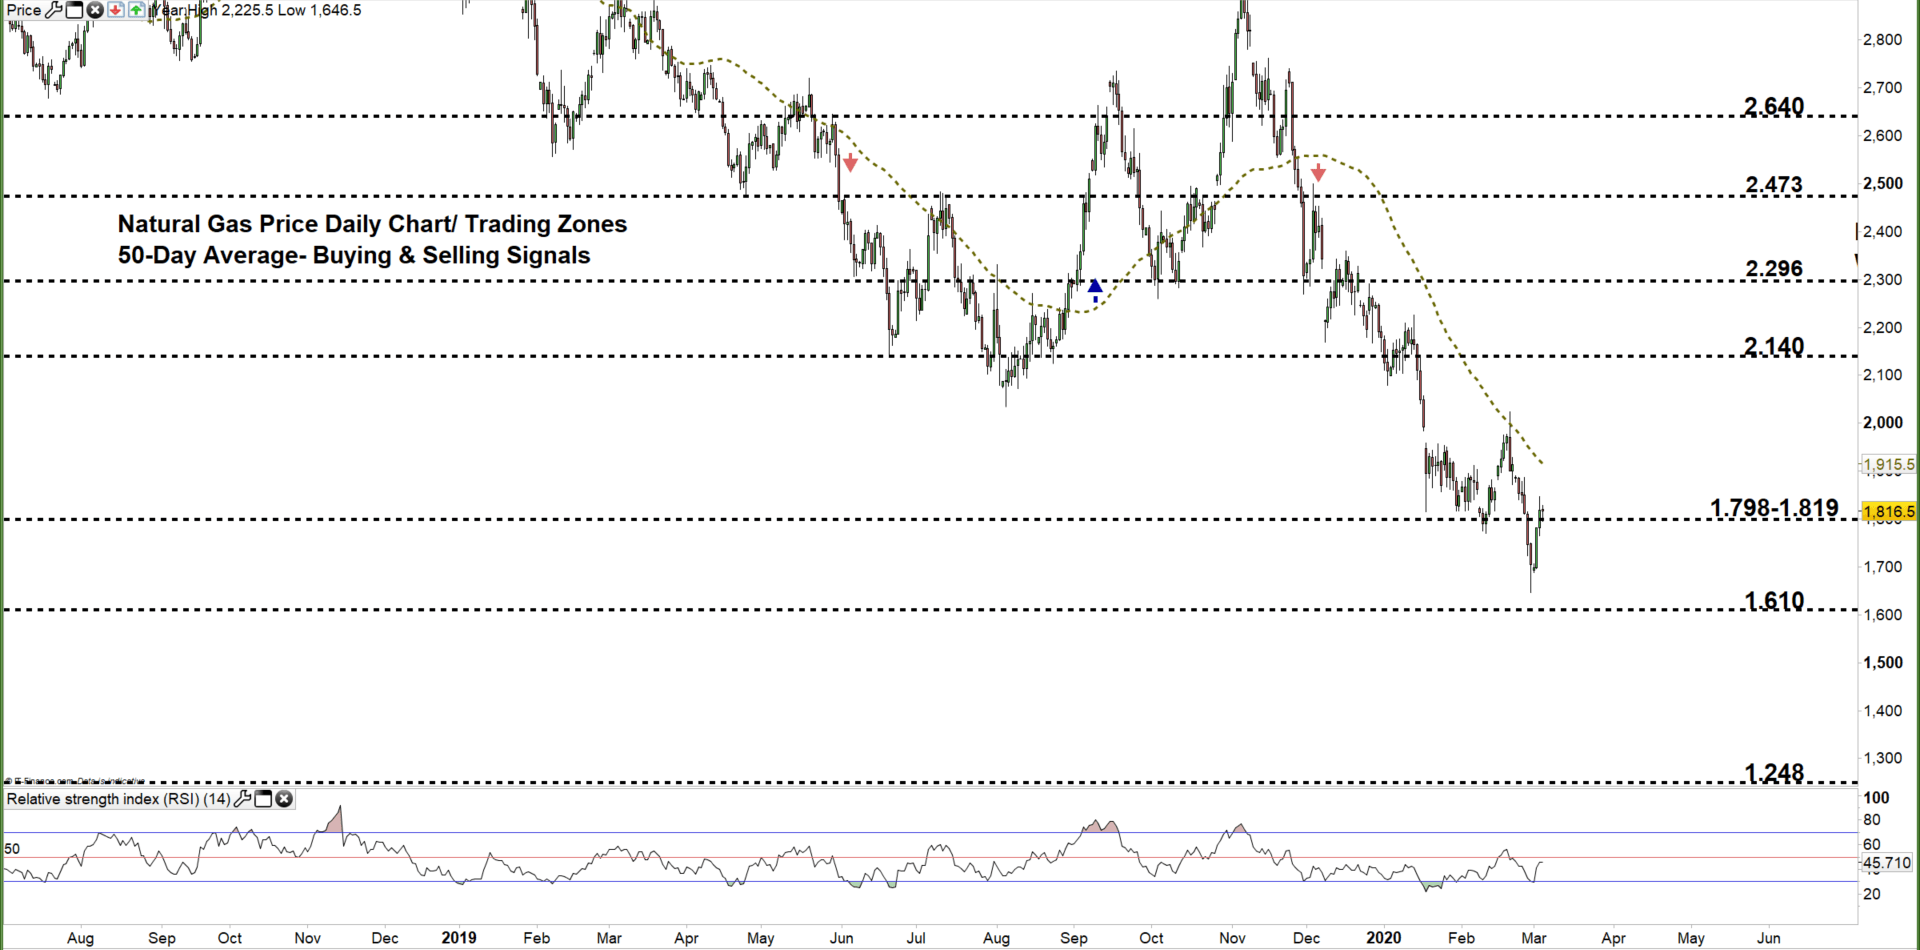
Nat-Gas DAILY Price CHART (JUL 23, 2018 – Mar 4, 2020) Zoomed Out

Natural Gas DAILY Price CHART (DEc 5 – Mar 4, 2020) Zoomed IN
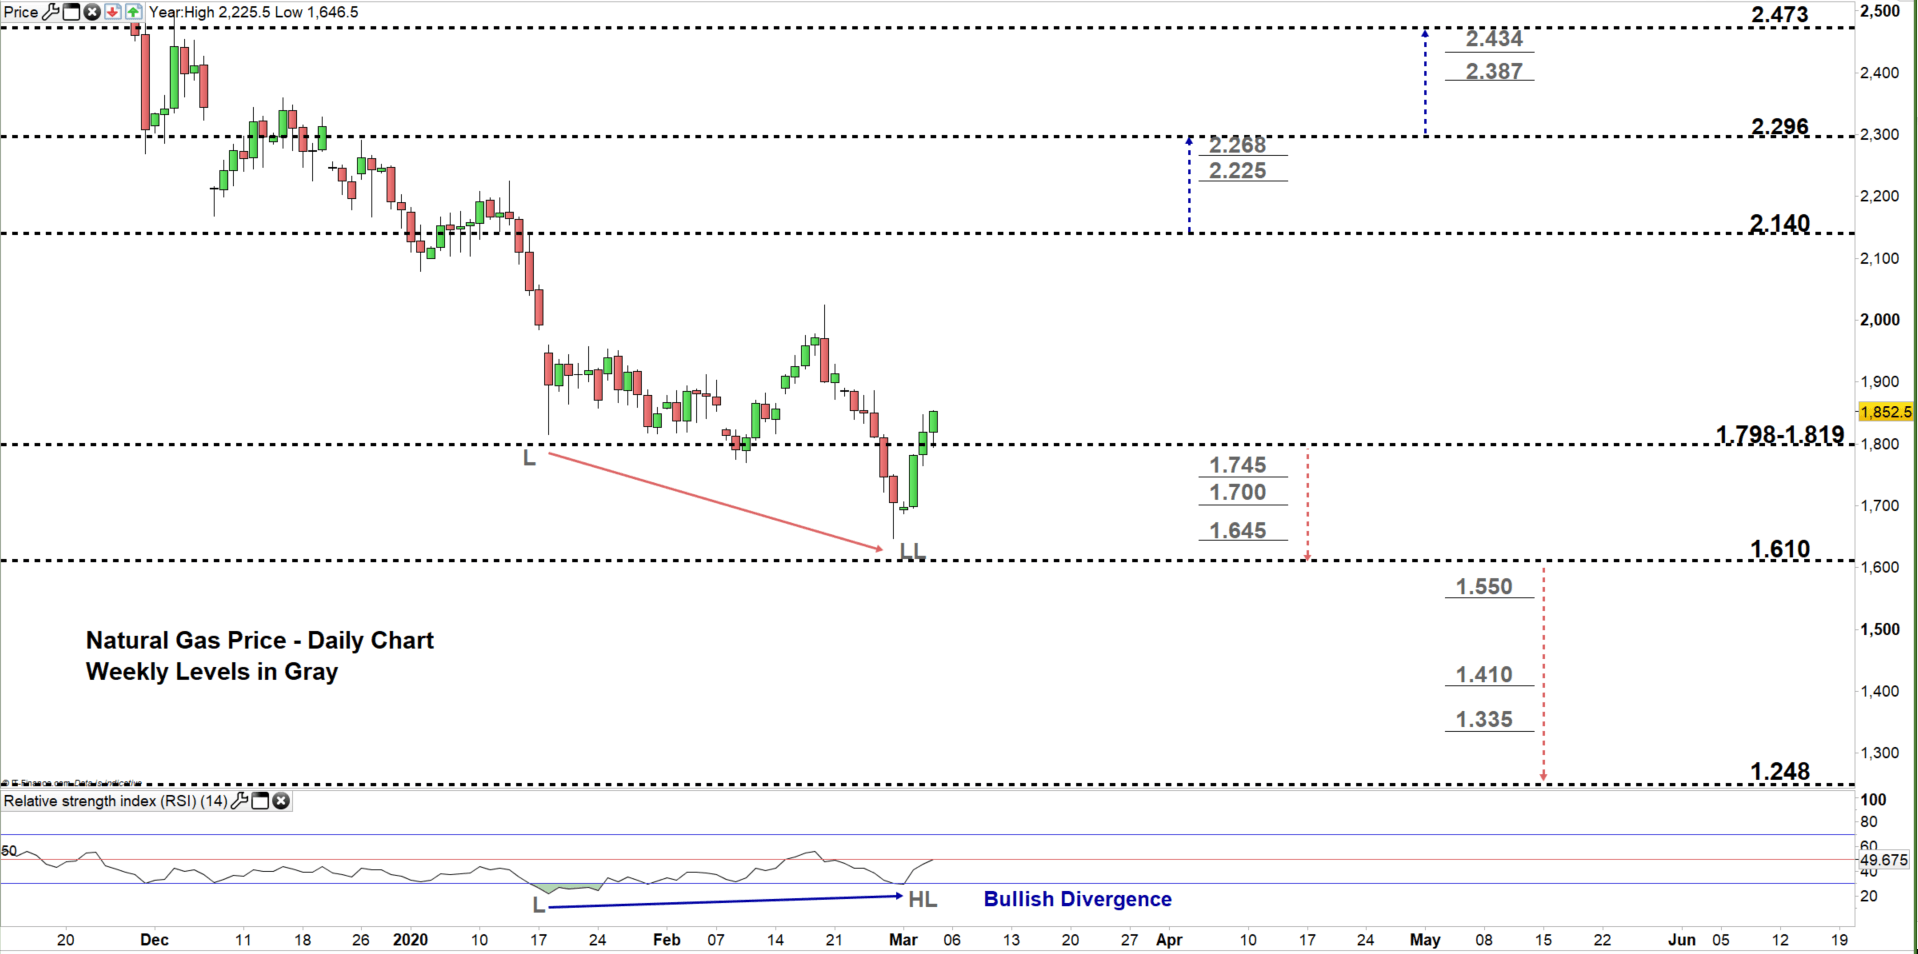
Looking at the daily chart, we noticed that yesterday natural gas moved to a higher trading zone $1.798 - $2.140 providing a bullish signal. Additionally, we spotted bullish divergence between the price and RSI as the first created a low with lower low meanwhile, the latter created a low with a higher low highlighting a possible reversal of current downtrend.
Hence, the price could be on the way for a test of the high end of the zone. Further close above this level might encourage bulls to push towards $2.296. That said, the weekly resistance level marked on the chart (zoomed in) should be considered.
On the flip-side, any close below the low end of the zone paves the way for bears to possibly press the price towards $1.610. Further close below that level could mean more bearishness towards $1.248. Special attention should be paid to the daily and weekly support levels printed on the chart as some traders may join/exit around these points.

Natural Gas price Four-Hour PRICE CHART (DEC 29 – Mar 4, 2020)

From the four- hour chart, we noticed that on Monday natural gas broke above the downtrend line originated from the Feb 20 high at $2.024 eyeing a test of $1.915. Yet, the price might rebound from the 26 high at $1.886 and develop inverted head and shoulders pattern.
Thus, a break above $1.915 may cause a rally towards the high end of current trading zone discussed on the daily chart. Although, the weekly resistance level underlined on the chart should be considered. On the other hand, a break below $1,745 may send the price towards $1.645. Nonetheless, the daily support level underlined on the chart would be worth monitoring.
Written By: Mahmoud Alkudsi
Please feel free to contact me on Twitter: @Malkudsi


