


Dow Jones Technical Forecast
- Dow Jones prints its all-time high
- Will bears control the Dow Jones price action?
Dow Jones Price – Bulls Pullback
On Feb 12, the Dow Jones rallied to its highest level of all times at 29,568 then retreated after as bulls seemed to cut back. On Friday, the weekly candlestick closed in the red with %1.4 loss.
The Relative Strength Index (RSI) dipped below 50 highlighting the end of uptrend move and a possible start of a downtrend momentum.
Dow Jones PRICE Daily CHART (July 1, 2018 – Feb 24, 2020) Zoomed OUT


Dow Jones PRICE Daily CHART (AUg 8 – Feb 24, 2020) Zoomed IN

Looking at the daily chart, we notice that last week Dow Jones reversed back to the uptrend channel originated form the Feb 25 high last year at 26,241, see the chart (zoomed out). This week the Dow opened with a gap to the downside moving to a lower trading zone 28,162- 28,845.
Thus, a close below the low end opens the door for bears to press towards the vicinity of 27,345-19. Further close below this level could mean more bearishness towards 26,713. Yet, the weekly support levels underlined o the chart (zoomed in) should be considered as some traders could join/exit the market around these levels.
In turn, any failure in closing below the low end could mean bears’ reluctance to take charge. This could lead some of them to pull back reversing the price’s direction towards the high end of the zone. Further close above this level, might cause a rally towards the aforementioned Feb 12 high. That said, the daily resistance levels underscored on the chart should be kept in focus.

Dow Jones Four Hour PRICE CHART (DEC 20, 2018 – Feb 24, 2020)
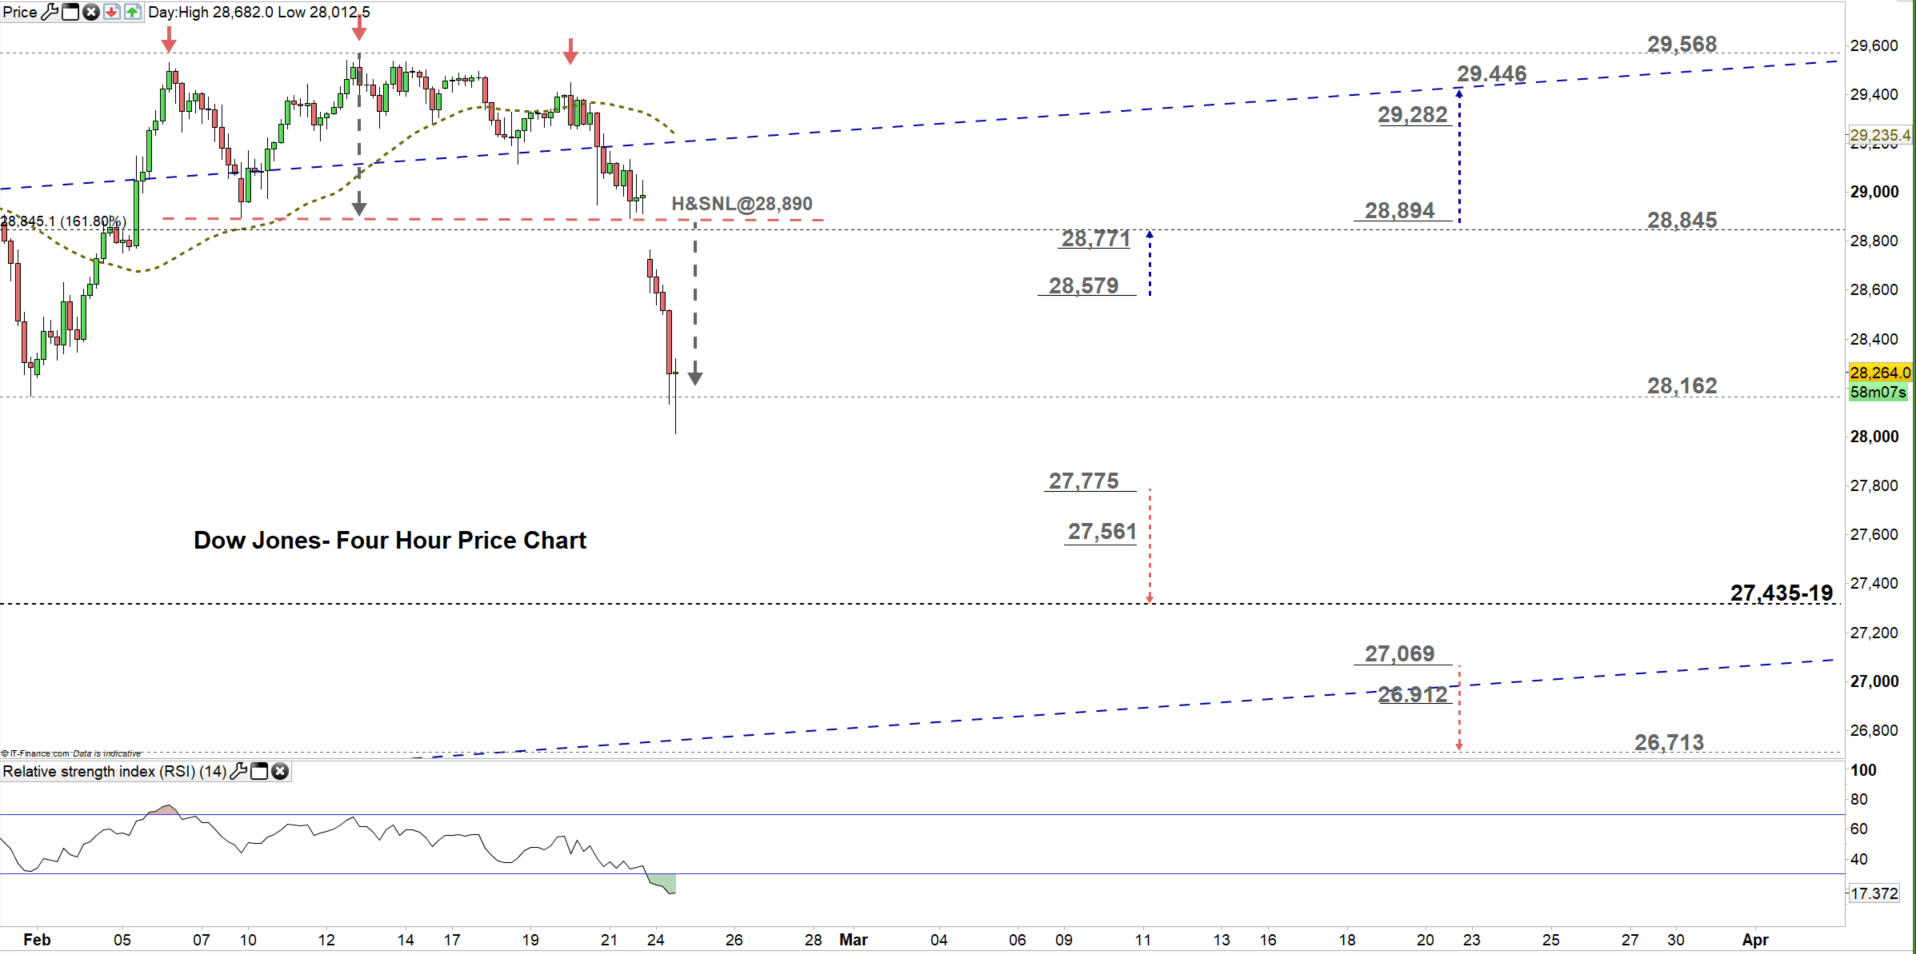
Looking at the daily chart, we notice this week the Dow Jones broke below the neckline of head and shoulders pattern residing at 28,890 hinting to press towards the low end of the trading zone discussed above on the daily chart.
Thus, a break below 27,775 could send the price towards 27,435. Yet, the weekly support level underscored on the chart should be watched closely. On the flip-side, a break above 28,579 might cause a rally towards the high end of current trading zone. Although, the daily resistance level printed on the chart would be worth monitoring.
See the chart to figure out more about the key technical levels in a further bullish/bearish scenario.
Written By: Mahmoud Alkudsi
Please feel free to contact me on Twitter: @Malkudsi


