


Copper Technical Forecast
- Will Copper bears comeback?
- Breakout levels to consider
Copper Price – Bears Pull back
On Thursday, Copper printed its highest level in over two weeks at $5.814. On Friday, the market closed the weekly candlestick in the green with 1.7% gain. This week, the price rallied further then paused, highlighting trader’s indecision at this stage.
The Relative Strength index (RSI) remained flat below 50 reflecting weak bears in a bearish market.
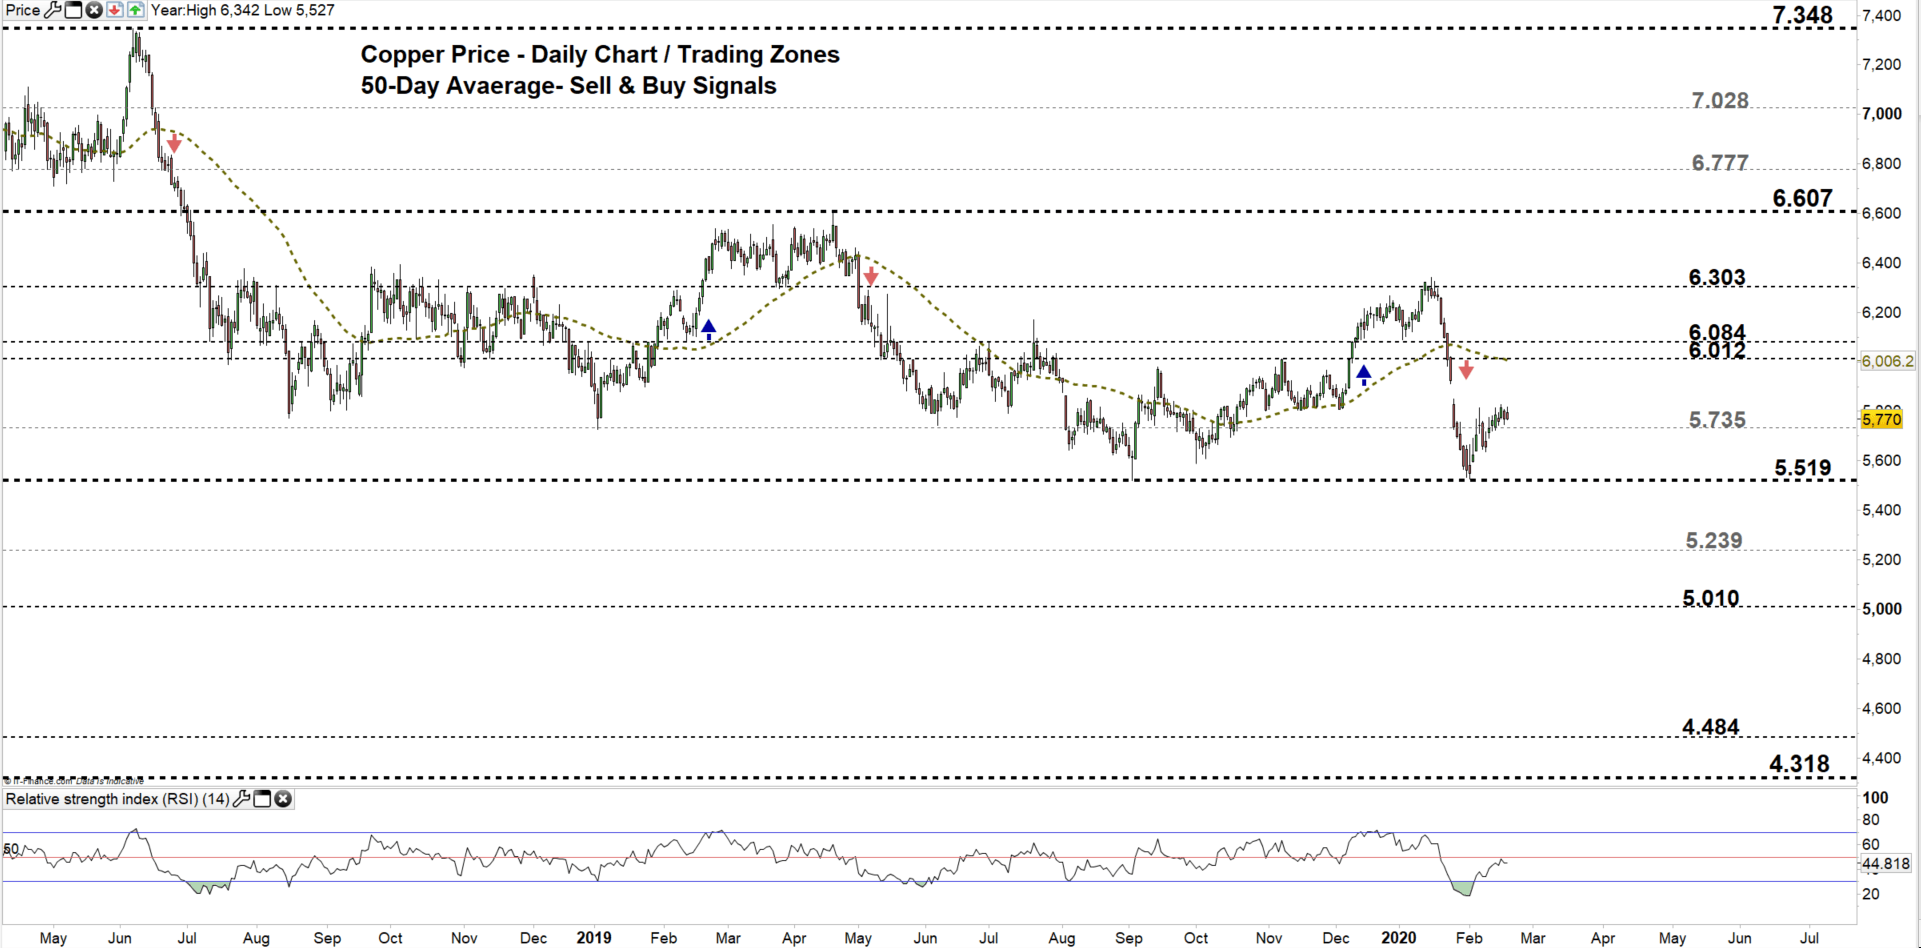
Copper DAILY PRICE CHART (April 30, 2018 – FEb 19, 2020) Zoomed out

Copper DAILY PRICE CHART (OCt 12 – FEb 19, 2020) Zoomed In
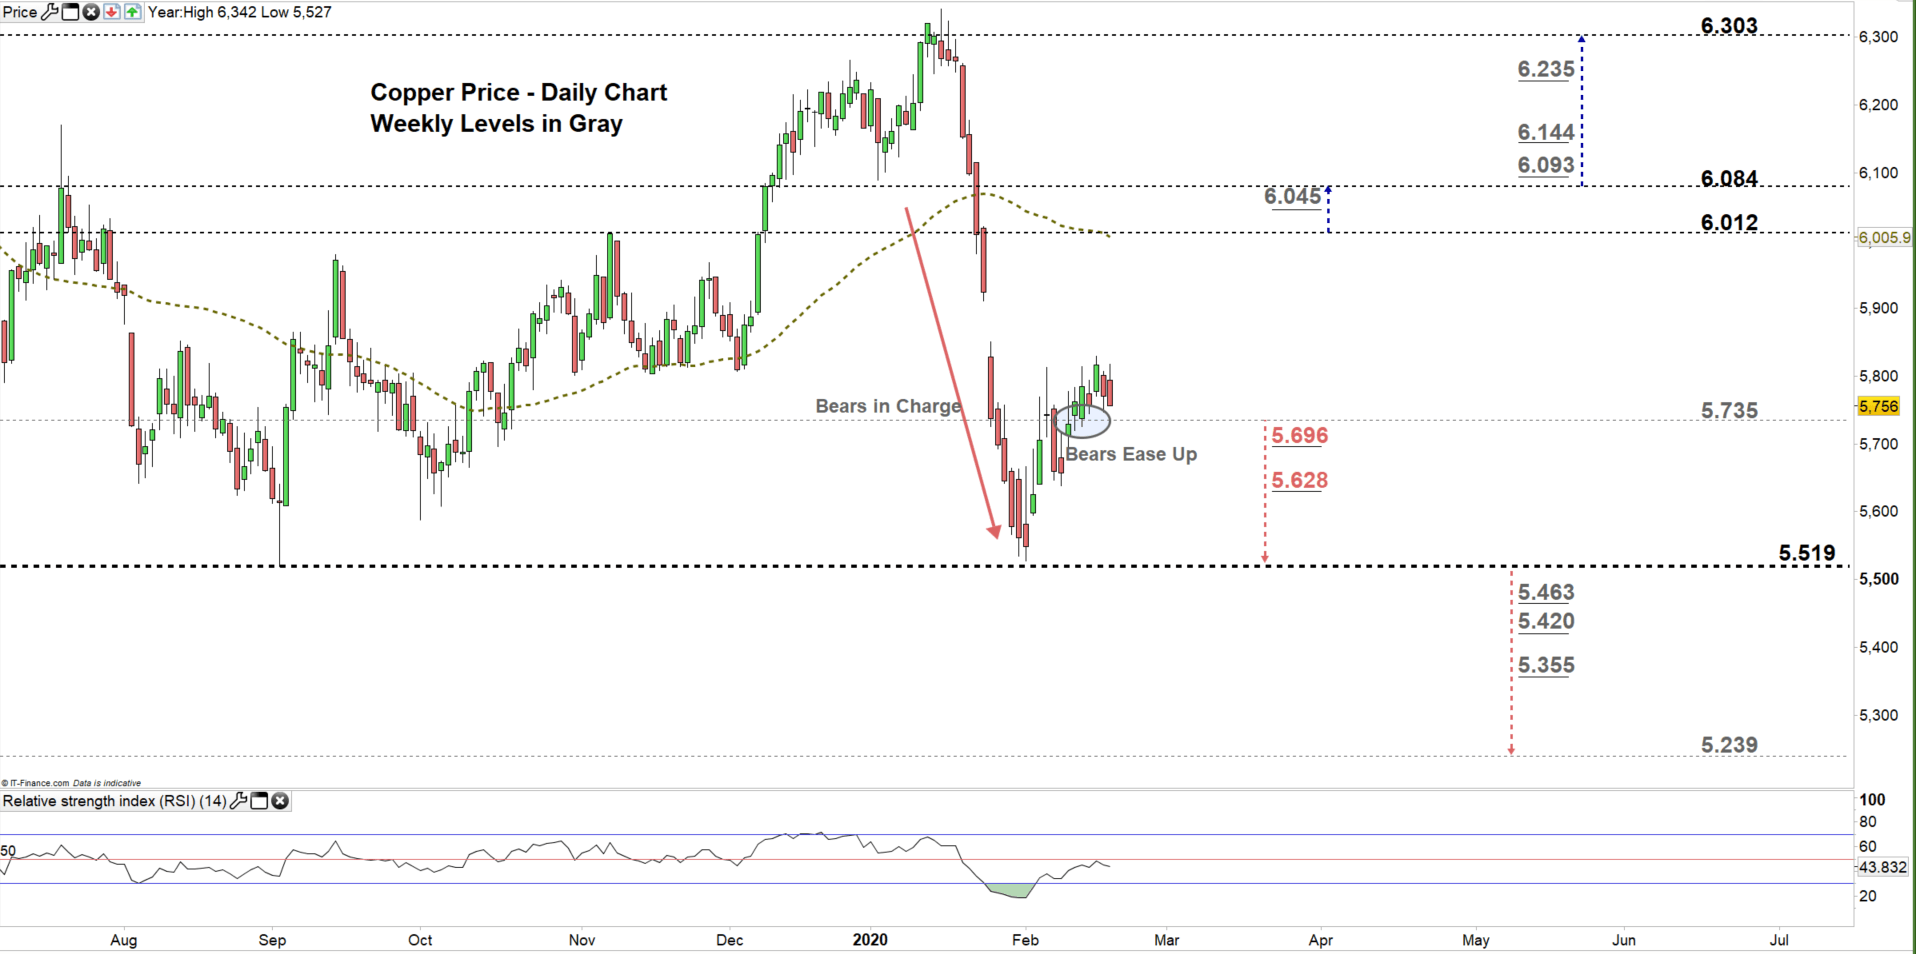
Looking at the daily chart, we notice in early February Copper rebounded from $5.527- its lowest level in five months. The price rallied after as bears seemed to cover. On Feb 12, bears eased up even more allowing the metal to rally to a higher trading zone $5.519 - $5.735 .
A close above the high end of the zone could send the price even higher towards $6.084. Further close above this level opens the door for bulls to push towards $6.303. Yet, the weekly resistance levels underlined on the chart (zoomed in) would be worth monitoring.
In turn, a close below the low end of the zone indicates a possible bears comeback. In that scenario, they might press towards $5.519. Further close below this level may resume bearish price action towards $5.239. That said, the daily and weekly support levels underscored on the chart should be kept in focus.

CoPper Four-HOUR PRICE CHART (Jan 23 – FEb 19, 2020)
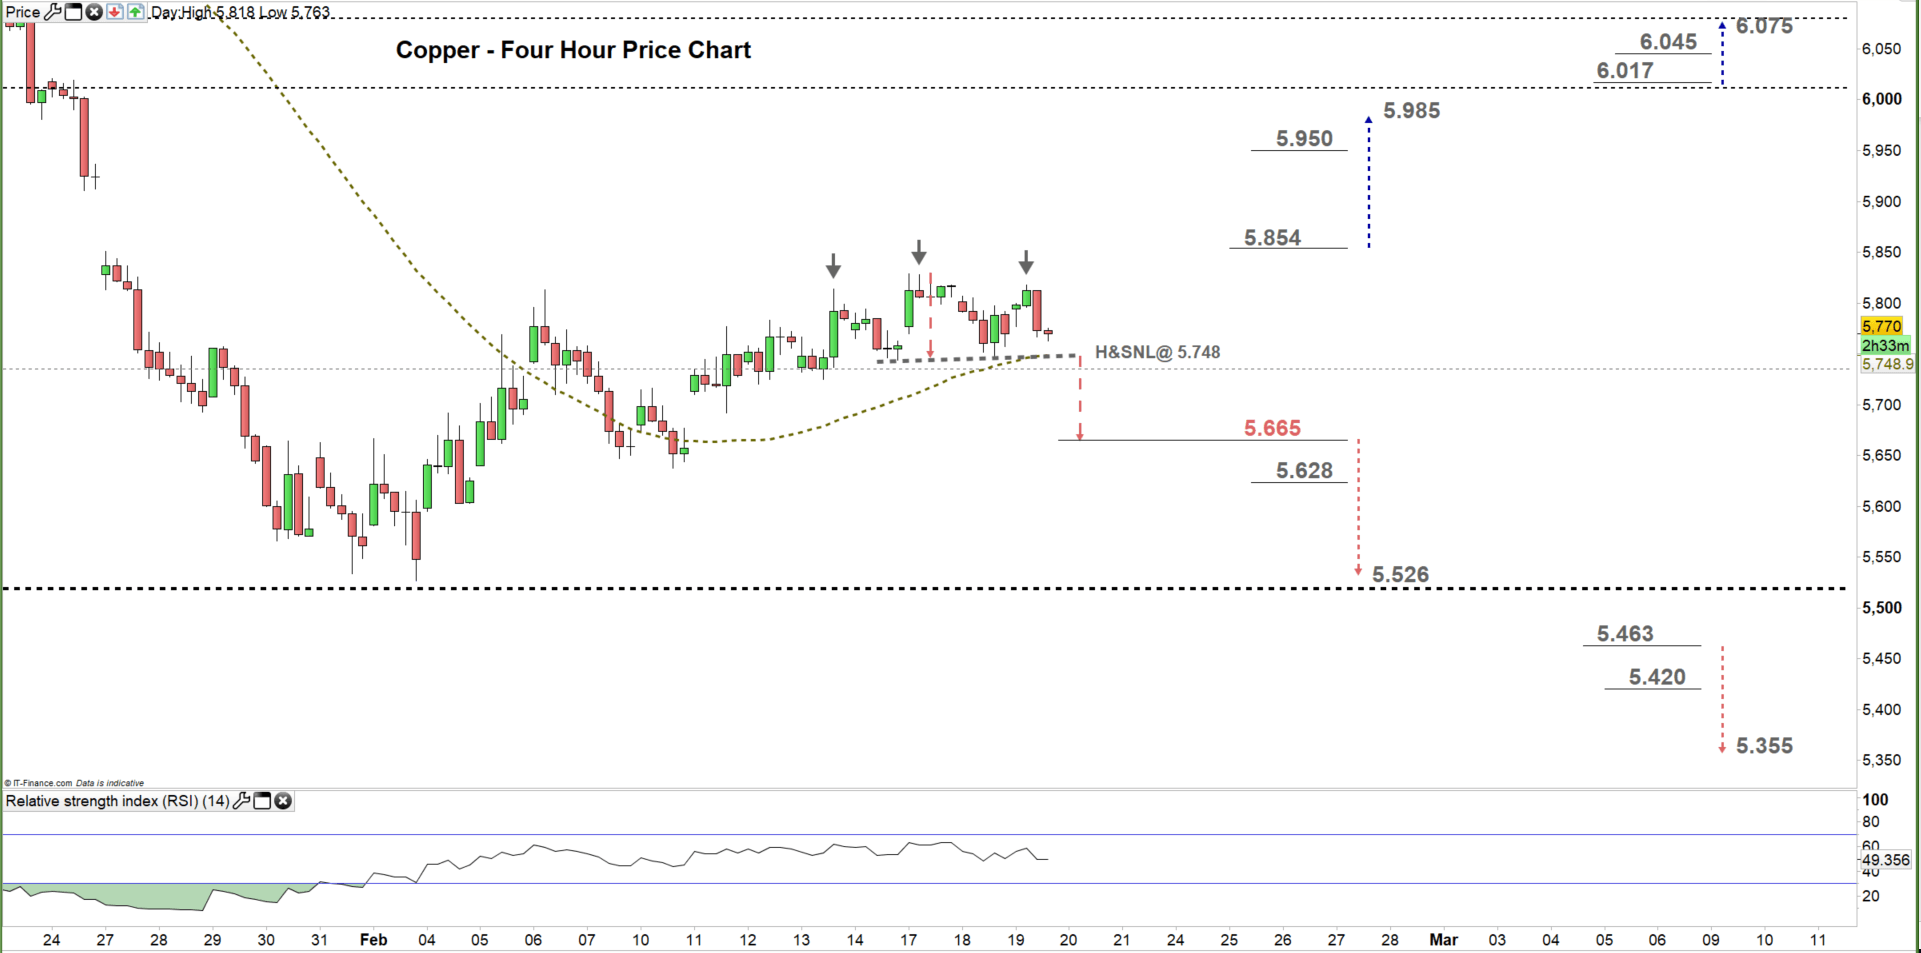
From the four-hour chart, we noticed that in the second week of February Copper pointed higher. Today, the price has carved out a lower high at $5.818 and developed head and shoulders pattern signaling a possible reversal. Therefore, a break below the neckline located at $5.748 could send the market towards $5.665.
A break below $5.665 might send Copper towards $5.526. Nevertheless, the weekly support level printed on the chart should be watched closely. On the flip-side, a break above $5.854 negates the head and shoulders pattern and could cause a rally towards $5.985. Although, the weekly resistance level marked on the chart should be considered.
See the chart to know more about the key technical levels in a further bullish/bearish move.
Written By: Mahmoud Alkudsi
Please feel free to contact me on Twitter: @Malkudsi


