


Bitcoin & Litecoin Prices Technical Outlook
Bulls in Charge
Last week, Bitcoin surged to its highest level in nearly three months at $9.564, then closed the weekly candlestick in the green with 10% gain. Similarly, Litecoin rallied to its highest level in over three months. However, the market closed the weekly candlestick with nearly 24% gain.
Alongside that, the Relative Strength Index (RSI) remained above 50 highlighting the bullish outlook of both markets.
Bitcoin PRICE DAILY CHART (OCt 2, 2018 – FEB 5, 2020) Zoomed Out


Bitcoin PRICE DAILY CHART (Sep 13 – FEB 5, 2020) Zoomed In
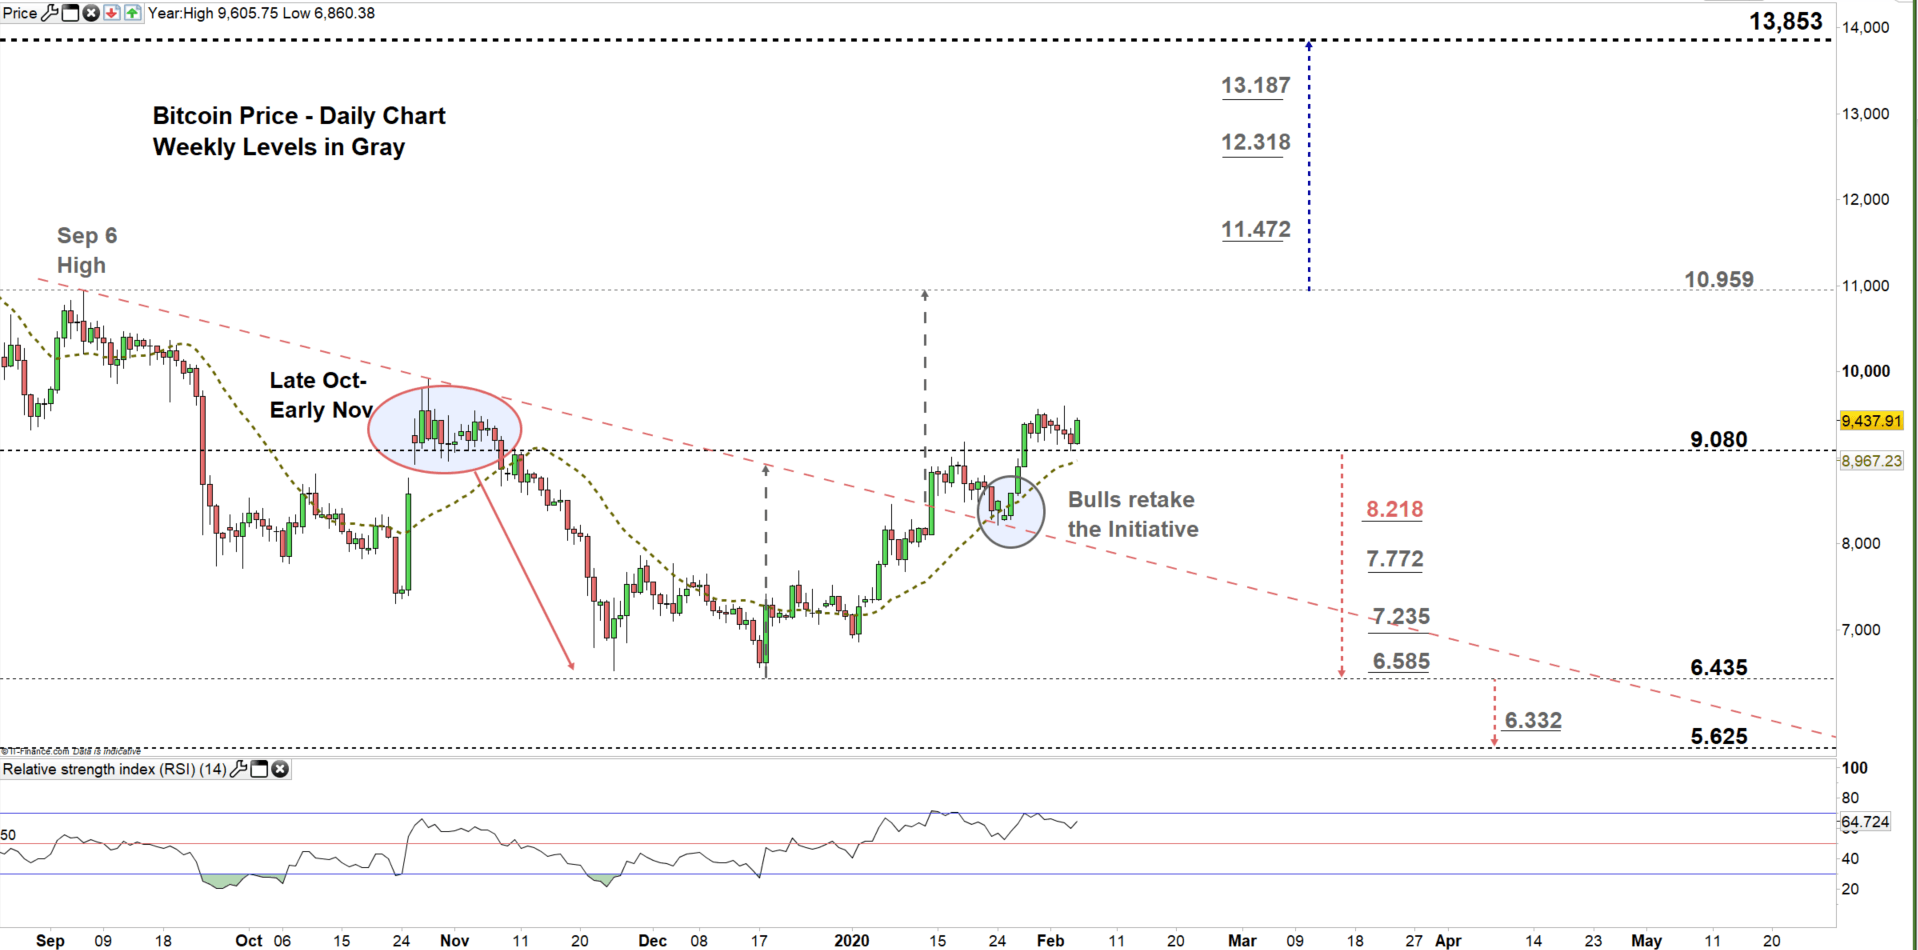
Looking at the daily chart, we notice that on Jan 14 the price broke above the downtrend line originated from the Sep 6 high at $10.940. On Jan 24 the price remained above the downtrend line then closed above the 50-day average signaling that bulls were not done yet.
Last week, the crypto currency rallied to a higher trading zone $9.080 - $10.959 and yesterday rebounded from the low end of the zone. This reflects that bulls could push towards the high end of the zone. Further close above this level may encourage more bulls to join the market towards $13.853. In that scenario, the weekly resistance levels underlined on the chart (zoomed in) should be monitored.
In turn, any close below the low end of the zone may repeat the late Oct-early Nov scenario i.e. could lead more bulls to cut back and reverse the BTC/USD course towards $6.435. Having said that, a special attention should be paid to the daily and weekly support levels marked on the chart.

LitEcoin PRICE DAILY CHART (Sep 26, 2018 – FEB 5, 2020) Zoomed Out

LitEcoin PRICE DAILY CHART (Aug 10 – FEB 5, 2020) Zoomed In
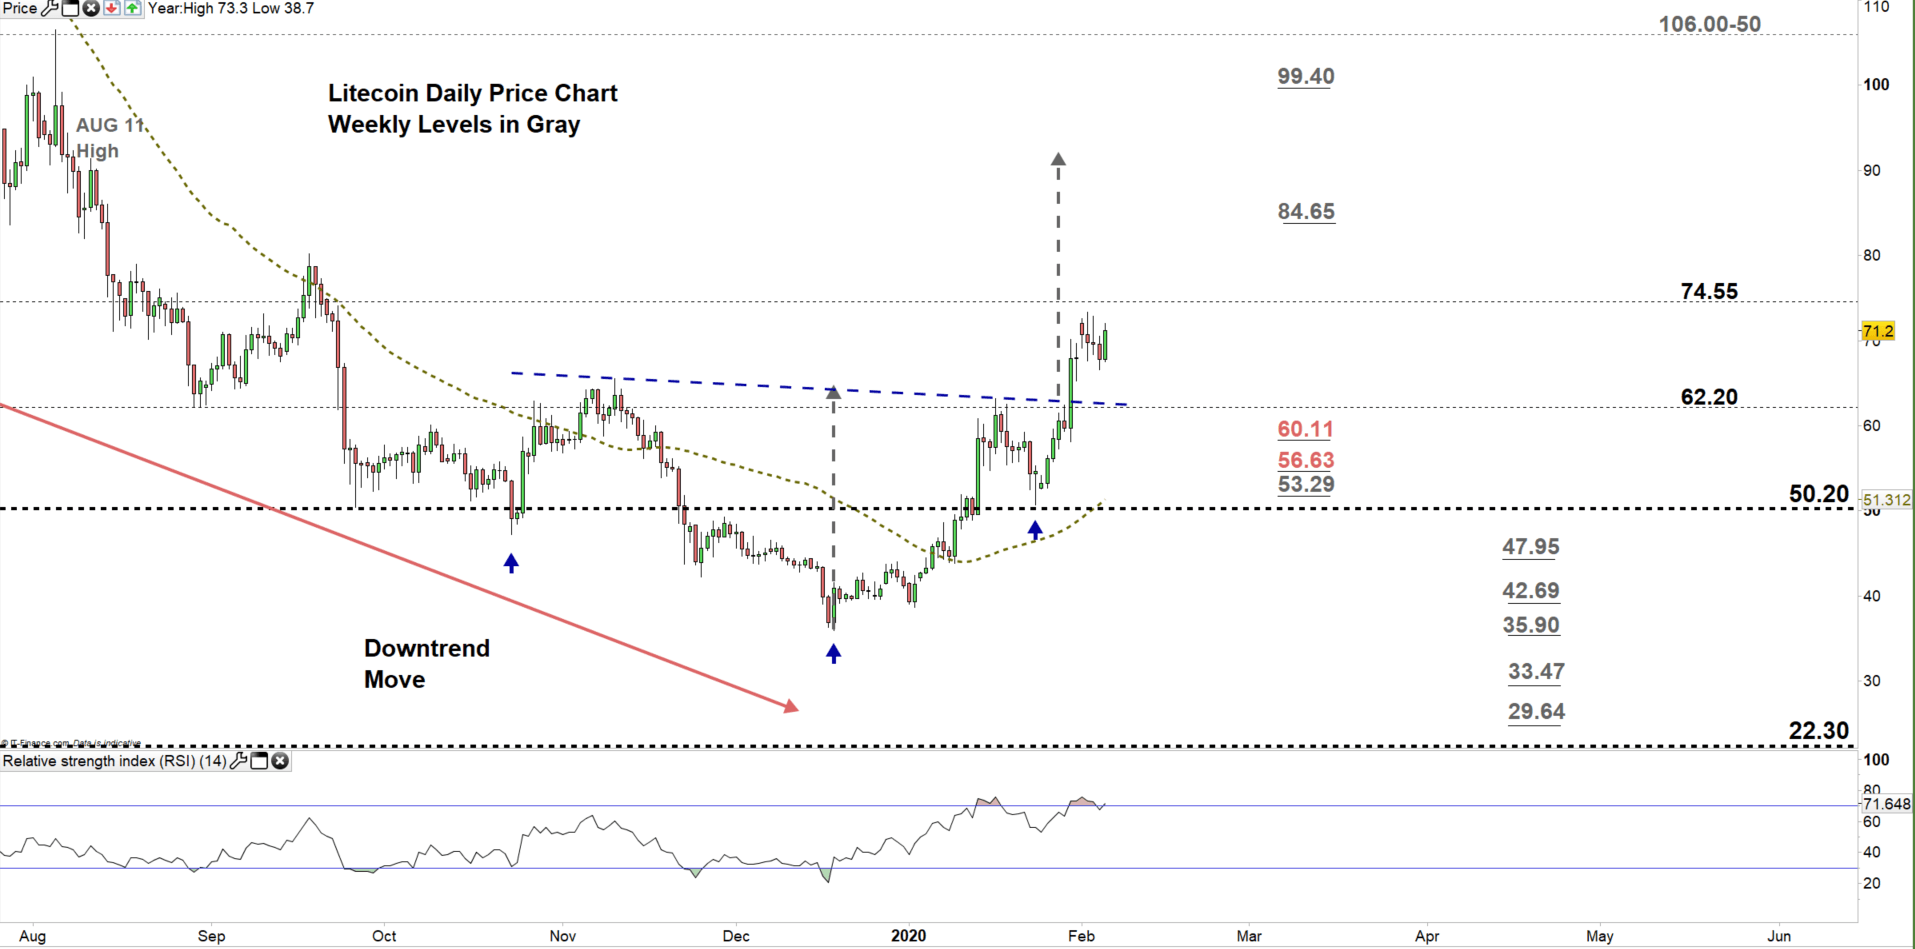
From the daily chart, we notice that on Jan 30 Litecoin rallied to a higher trading zone $62.20 - $74.55 and broke above the neckline of inverted head and shoulders located at $62.80 eyeing a test of Aug 11 high at $91.40.
A close above the high end of the zone could mean more bullishness towards the vicinity of $106.00-50. Nevertheless, the weekly resistance levels printed on the chart (zoomed in) should be kept in focus.
On the other hand, any failure in closing above the high end of the zone indicates bull’s hesitation. This could lead some of them to exit the market and reverse LTC/USD direction towards the low end of the zone. Further close below this level could negate the inverted head and shoulders pattern and send possibly send the price towards $50.20. Although, the daily and weekly support levels marked on the chart should be watched closely.
Written By: Mahmoud Alkudsi
Please feel free to contact me on Twitter: @Malkudsi


