


Copper Technical Forecast
- Copper declines to its lowest level in 2020
- Copper chart points out a possible rally
Copper Price – Bears Ease Up
On Friday, Copper tumbled to $5.534 – its lowest level in nearly four months, then closed the weekly candlestick in the red for the second week in a row with 6.1% loss. This week, the price opened with a gap to the upside then rallied as some shorts seemed to cover up.
Alongside that, the Relative Strength index (RSI) remained in oversold territory emphasizing the strength of downtrend momentum.
Copper DAILY PRICE CHART (May 30, 2018 – FEb 4, 2020) Zoomed out


Copper DAILY PRICE CHART (May 6 – FEb 4, 2020) Zoomed In

Looking at the daily chart, we notice on Jan 23 reversed its course as discussed in our last update then closed below the 50-day average generating a bearish signal. On Jan 27, the metal opened with a gap to the downside then and fell to a lower trading zone $5.519 - $5.735.
The price rallied before testing the low end of the zone as bear showed more sway. Thus, the market could be on its way for a test of the high end of the zone. Further close above this level could lead more bears to exit the market and increase the likelihood of the price to push towards $6.012. Yet, the weekly resistance levels underlined on the chart (zoomed in) should be considered.
In turn, a close below the low end of the zone could embolden bears to press towards $5.010. That said, the weekly support levels and area marked on the chart should be watched along the way as some traders may exit/join the market around these levels.

CoPper Four-HOUR PRICE CHART (Dec 1 – FEb 4, 2020)
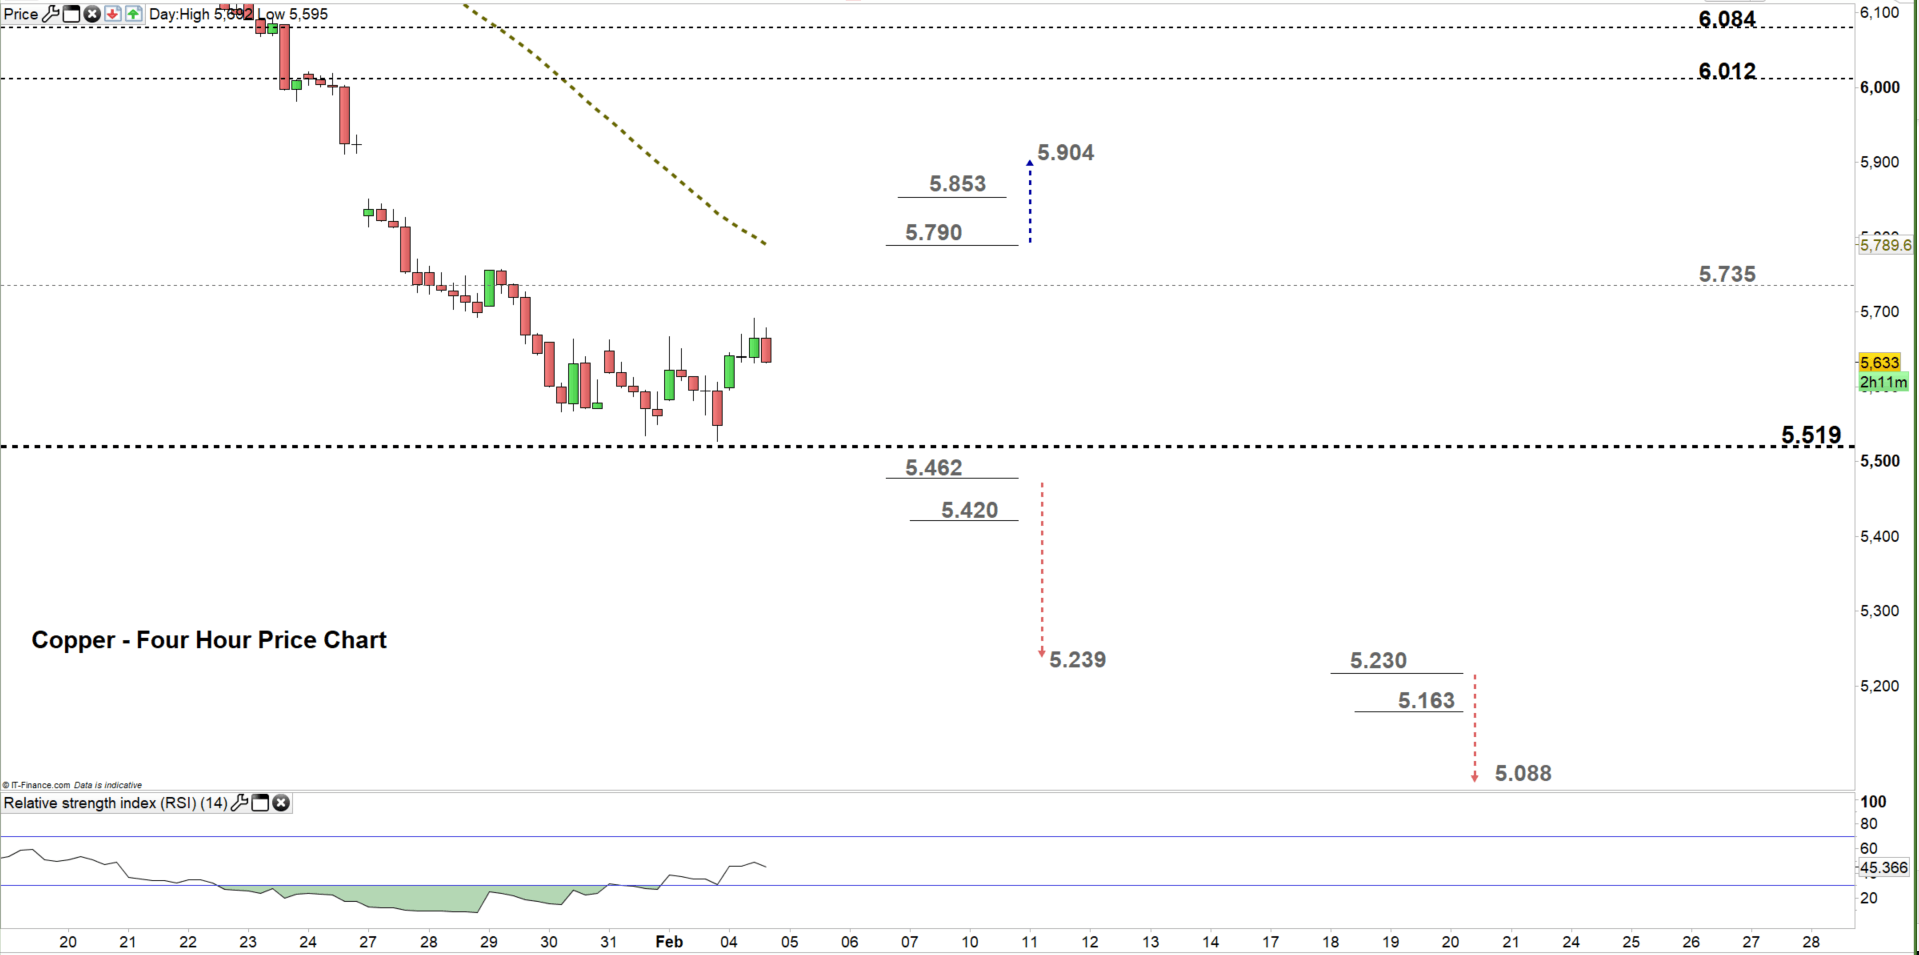
From the four-hour chart, we noticed that yesterday Copper rebounded from its lowest level in 2020 then rallied eyeing a test of the high end of the trading zone discussed above on the daily chart.
A break above $5.790 could lead the market towards $5.904. Nevertheless, the weekly resistance level underscored on the chart should be kept in focus. On the flip side, a break below $5.462 could send the price towards $5.239. Although, the weekly support printed on the chart would be worth monitoring.
See the chart to know more about the key technical levels in a further bullish/bearish move.
Written By: Mahmoud Alkudsi
Please feel free to contact me on Twitter: @Malkudsi


