


Natural Gas Technical Outlook
- Natural gas price action
- Nat gas Charts

Natural Gas – Multi Month Low
Last week, natural gas tumbled to $2.078 – its lowest level in nearly five months. On Friday, the weekly candlestick closed in the red with over 5.0% loss.
This week, the Relative Strength Index (RSI) remained flat below 50 reflecting a paused downtrend move.
Having trouble with your trading strategy? Here’s the #1 Mistake That Traders Make
Nat-Gas DAILY Price CHART (May 15, 2018 – JAN 9, 2020) Zoomed Out

Nat-Gas DAILY Price CHART (Sep 27 – JAN 9, 2020) Zoomed IN

Looking at the daily chart, we notice since Monday Natural gas has been trading in a higher trading zone $2.141 - $2.209. The price failed twice this week to decline to the lower zone, highlighting seller’s hesitation.
A close above the high end of the zone could lead more sellers to exit the market. This may open the door for buyers to take charge and rally the price towards $2.473. In that scenario, the weekly resistance levels marked on the chart should be considered as some market participants could exit at these points.
On the other hand, a close below the low end may embolden sellers to lead the price towards $2.034. Further close below this level might mean more bearishness towards $1.915. That said the 2.000 handle with the weekly support level underlined on the chart would be worth monitoring.

Natural Gas price Four-Hour PRICE CHART (Nov 5 – JAN 9, 2020)
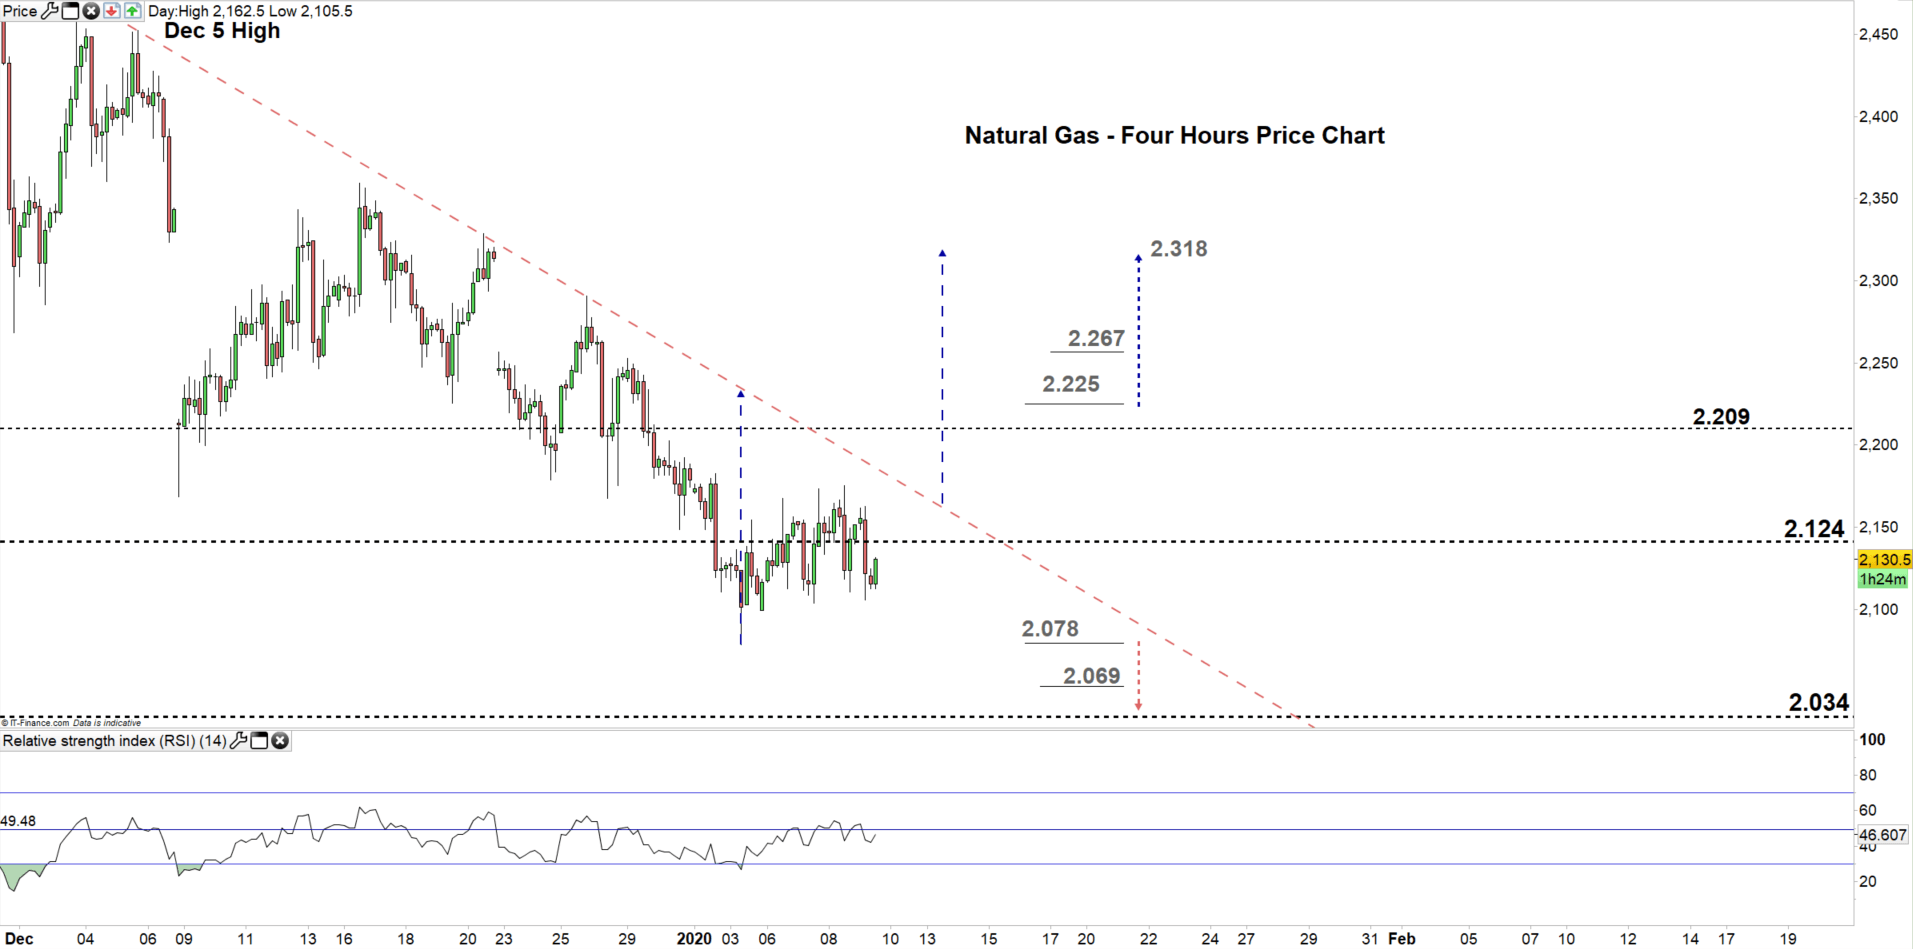
From the four- hour chart, we notice on Dec 31 natural gas resumed bearish price action and created a lower low at $2.078. This week, the price has corrected its downtrend move and created a higher low at $2.103 .Currently, nat gas could be on its way to test the downtrend line originated from the Dec 5 high at $2.452.
Thus, a break above $2.225 may cause a rally towards $2.318. Although, the weekly resistance level underlined on the chart should be kept in focus. On the flip side, a break below $2.078 could send the price towards $2.034. Yet, the weekly support level underscored om the chart should be watched closely.
Just getting started? See our Beginners’ Guide for FX traders
Written By: Mahmoud Alkudsi
Please feel free to contact me on Twitter: @Malkudsi


