


USD/TRY Technical Analysis

USD/TRY Price – Multi Month High
On Friday, USD/TRY rallied to 5.9783 – its highest level in over six months. Then closed the weekly candlestick in the green with a 0.3% gain.
Alongside this, the Relative Strength Index (RSI) remained in overbought territory emphasizing that buyers were in control.
Having trouble with your trading strategy? Here’s the #1 Mistake That Traders Make
USD/TRY DAILY PRICE CHART (Jan 28, 2018 – Jan 06, 2020) Zoomed Out

USD/TRY DAILY PRICE CHART (June 25 – Jan 06, 2020) Zoomed In
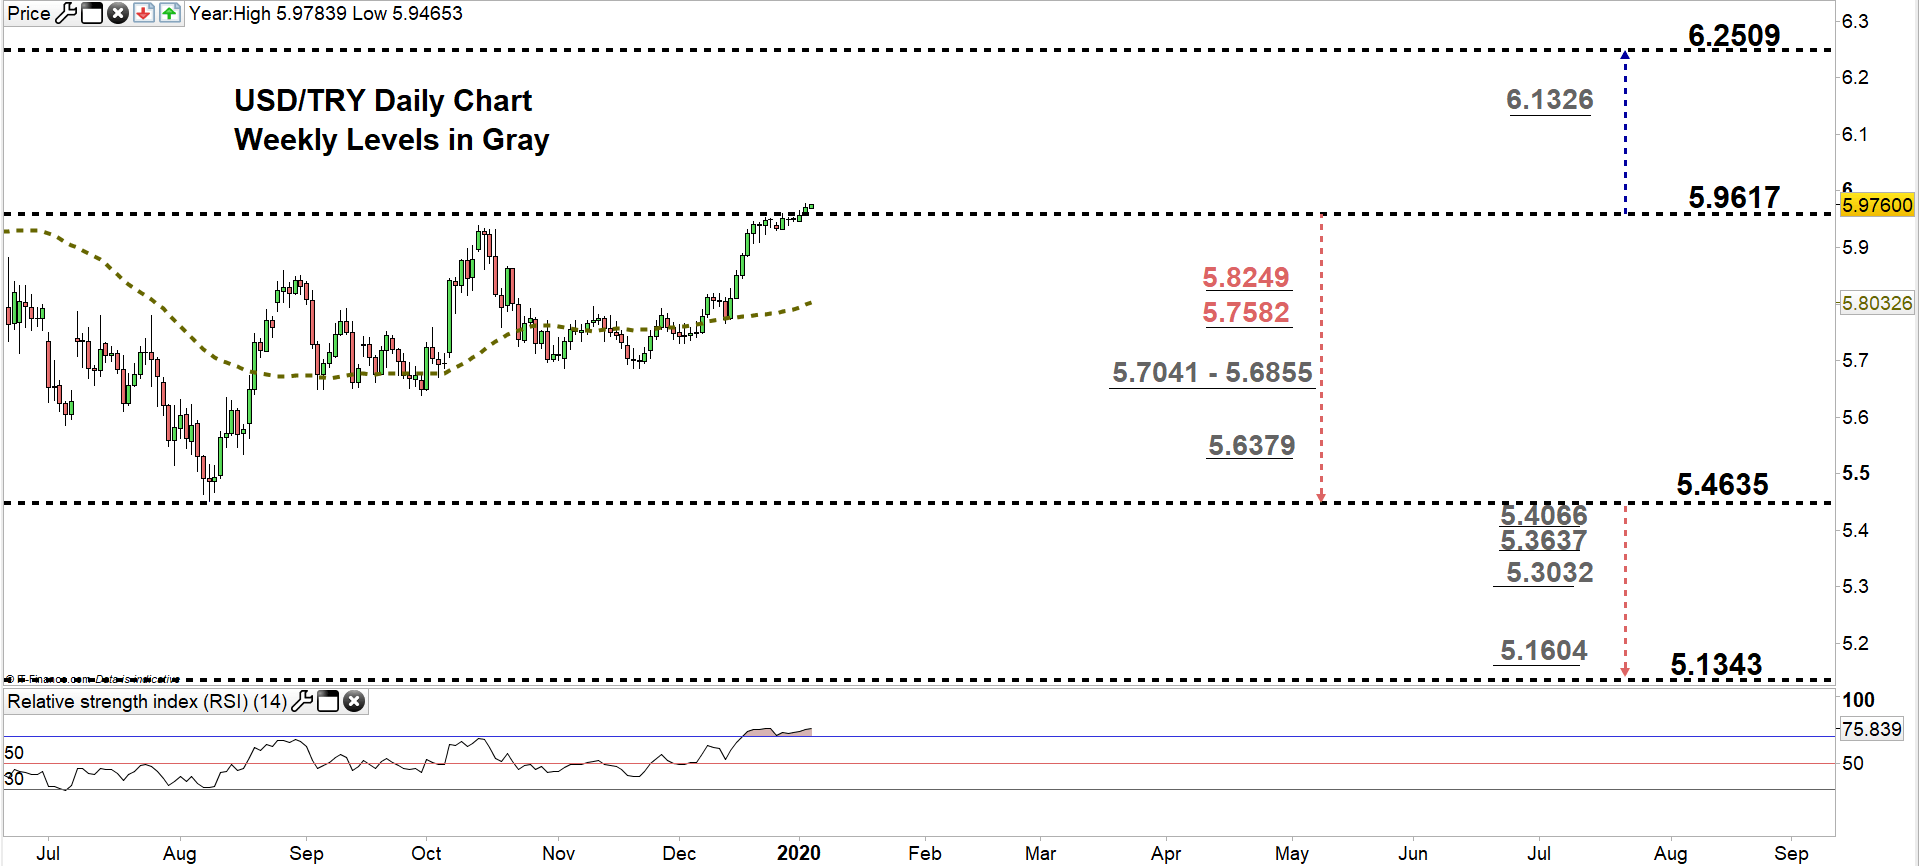
Looking at the daily chart, we notice on Friday USD/TRY rallied to a higher trading zone 5.9617 – 6.2509. This week, the price remained trading in the aforementioned zone eyeing a test of the high end. Nevertheless, the uptrend move could weaken at the weekly resistance level underlined on the chart as some buyers may take profit at this point.
That said, any close below the low-end signals buyer’s hesitation. This could lead more buyers to exit the market and reverse the pair’s direction towards 5.4635. In that scenario, the daily and weekly support levels and area marked on the chart should be considered.

USD/TRY Four-HOUR PRICE CHART (DEC 6 – Jan 06, 2020)

From the four-hour chart, we notice on Friday USD/TRY rallied to 5.9783 then declined. Today, we notice the pair could be developing a double top pattern with the neckline residing at 5.976. A break below the neckline could send the price back to 5.9617.
Further break below 5.9231 could lead USDTRY towards 5.8452. Although, the daily support level underlined on the chart should be kept in focus. On the other hand, a break above 5.9828 could push USDTRY towards 6.01326. Yet, the weekly resistance level underscored on the chart would be worth monitoring.
Just getting started? See our Beginners’ Guide for FX traders
Written By: Mahmoud Alkudsi
Please feel free to contact me on Twitter: @Malkudsi


