


USD/SGD, USD/MYR, USD/PHP, USD/IDR - Talking Points
- US Dollar may reverse against the Singapore Dollar
- USD/MYR extended its decline after clearing support
- USD/PHP false breakout, USD/IDR faces key barrier

Singapore Dollar Technical Outlook
The US Dollar may be on the verge of a reversal against the Singapore Dollar. USD/SGD appears to have bottomed at 2019 lows which make for a psychological barrier between 1.3444 to 1.3472. Prices have left behind a Bullish Engulfing which with confirmation, could precede a turn higher. That places the focus on near-term falling resistance from December which if taken out, exposes 1.3513 – 1.3521.
Learn more about how the MAS conducts monetary policy and what matters for the Singapore Dollar !
USD/SGD Daily Chart
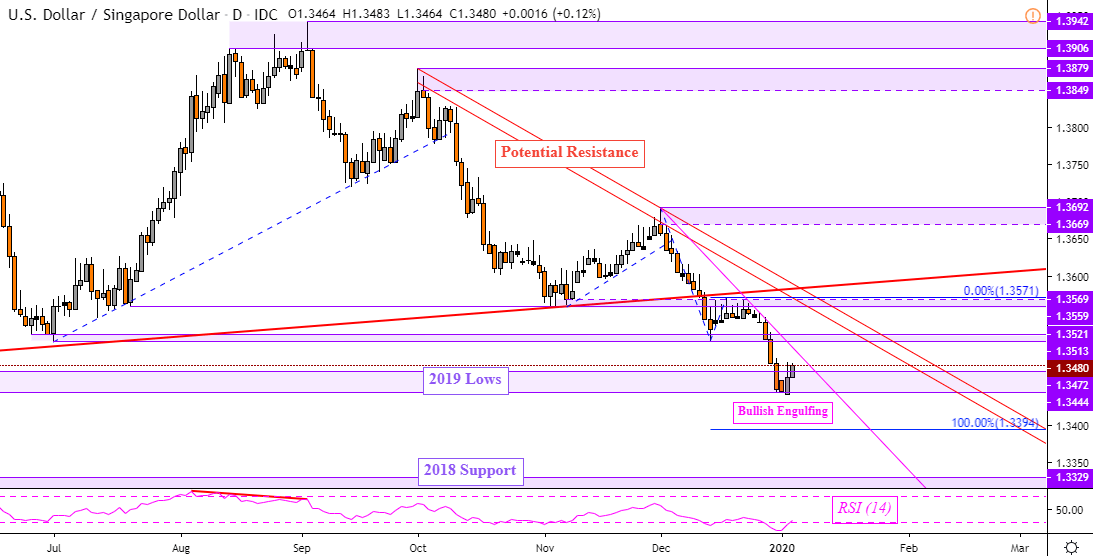
USD/SGD Chart Created in TradingView
Malaysian Ringgit Technical Outlook
The Malaysian Ringgit has extended its advance against the US Dollar after prices took out key rising support from March 2019. Since then, USD/MYR appears to have struggled to continue its descent after taking out the former psychological barrier between 4.0930 to 4.0950. A confirmatory daily close above this area could precede a push towards the falling trend line from November.
To stay updated on fundamental developments for ASEAN currencies, follow me on Twitter here @ddubrovskyFX
USD/MYR Daily Chart

USD/MYR Chart Created in TradingView
Philippine Peso Technical Outlook
This is as the Philippine Peso continues to see choppy trade after USD/PHP paused its downtrend back in November. Prices have since been consolidating between 50.40 and 51.14 with no imminent signs of a lasting breakthrough. The push above falling resistance from September appears to have been a false breakout. Keep in mind that rising support from 2013 was taken out last year, signifying a major reversal of trend.
USD/PHP Daily Chart

USD/PHP Chart Created in TradingView
Indonesian Rupiah Technical Outlook
The Indonesian Rupiah extended its advance against the US Dollar after taking out near-term rising support from September – as expected. USD/IDR has since slowed its descent as prices were caught within support (13848 – 13923). If this area is taken out, it would expose former resistance from March 2018 which may reinstate itself as new support.
USD/IDR Daily Chart
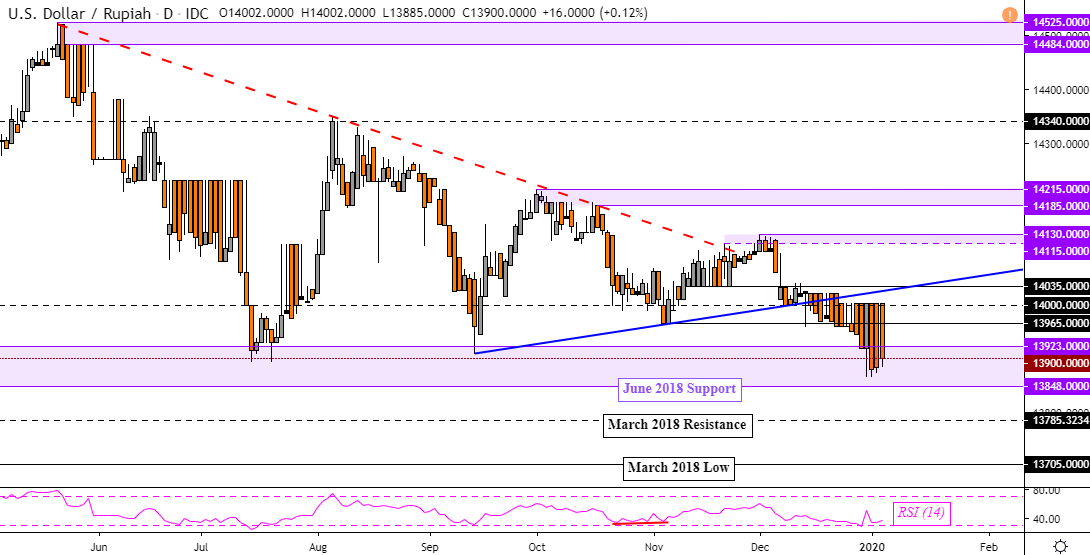
USD/IDR Chart Created in TradingView
--- Written by Daniel Dubrovsky, Currency Analyst for DailyFX.com
To contact Daniel, use the comments section below or @ddubrovskyFX on Twitter


