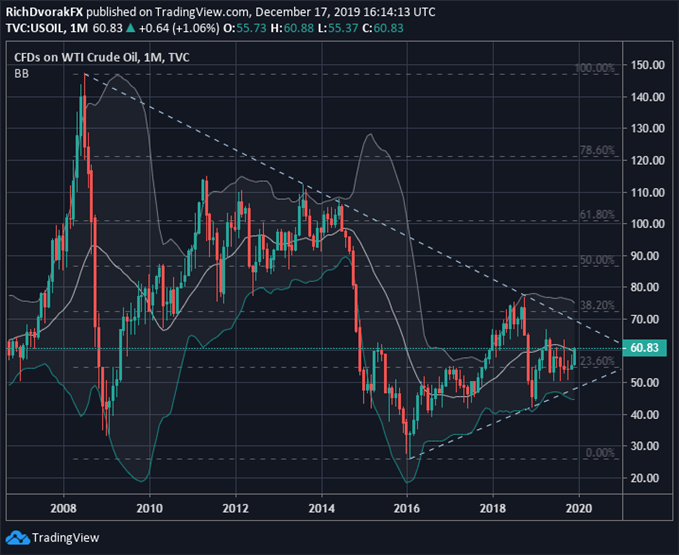
Crude oil prices have ripped and dipped throughout 2019 with the commodity getting jostled between positively and negatively sloped trendlines that have served as respective support and resistance lines, which appear to have formed a wedge pattern dating back several years.
CRUDE OIL PRICE CHART: MONTHLY TIME FRAME (CHART 4)

Chart created by @RichDvorakFX with TradingView
These falling and rising trendlines – in addition to upper and lower boundaries outlined by the 2-standard deviation Bollinger Bands – will look to keep the price of crude oil relatively contained. Taking a look at a monthly crude oil chart also brings to focus the 23.6% Fibonacci retracement level of the commodity’s trading range since its July 2008 peak recorded prior the onslaught sparked by the Global Financial Crisis. This region of technical confluence could be looked to as an area of support going forward.


-- Written by Rich Dvorak, Junior Analyst for DailyFX.com
Connect with @RichDvorakFX on Twitter for real-time market insight


