


VOLATILITY IN 2019 DRIVEN BY TRADE WARS, MONETARY POLICY, GEOPOLITICS, & RECESSION RISK
- Volatility across asset classes ripped and dipped throughout 2019 largely in response to market risk and uncertainty surrounding trade wars, monetary policy, geopolitics and recessions
- The Japanese Yen, Chinese Yuan, Dow Jones, crude oil and British Pound all experienced noteworthy episodes of volatility throughout 2019
- Enhance your market knowledge with our free Forecasts & Trading Guides available for download
The latest trade war rhetoric, changes in monetary policy regimes, geopolitical unrest and recession fears dominated markets throughout 2019.
Various asset classes like stocks, bonds, commodities and currencies have overwhelmingly reacted to these aforementioned fundamental themes, which may very well linger into the new year and spark volatility in the months ahead.
On that note, there have been several memorable episodes of volatility this past year, but the events listed below impacting price action in the Japanese Yen, Chinese Yuan, Dow Jones, crude oil and British Pound stand out in particular.
JAPANESE YEN FLASH CRASH – 03 JANUARY 2019

Chart created by @RichDvorakFX with TradingView
The JPY Flash Crash on January 03, 2019 sent the Japanese Yen skyrocketing and seemed to be a continuation of broader risk aversion that roiled major equity indices over preceding months.
The abrupt move into safe-haven currencies like the Japanese Yen occurred amid thin trade characterized by low liquidity during the US to APAC crossover as massive stop losses were taken out in AUD/JPY and TRY/JPY.
| Change in | Longs | Shorts | OI |
| Daily | -4% | 9% | 6% |
| Weekly | -24% | 24% | 7% |
CHINESE YUAN TOPS 7.0 PER DOLLAR AS TRUMP LEVIES TARIFFS – 05 AUGUST 2019

Chart created by @RichDvorakFX with TradingView
China’s central bank – the PBoC – has long defended the Chinese Yuan from depreciating above the 6.9500 price level against the US Dollar.
That all changed on August 06, 2019 after the PBoC and forex traders sent spot USD/CNH prices spiking above the ‘taboo’ 7.00 barrier as Sino-American trade tensions bulged.
PBoC intervention came in response to the year-long trade war waged between the US and China, hoping to offset tariffs levied by President Trump.
Read More – Watch the Chinese Yuan, PBoC for a US-China Trade War Gauge
DOW JONES GAPS HIGHER ON TRADE WAR OPTIMISM – 05 SEPTEMBER 2019
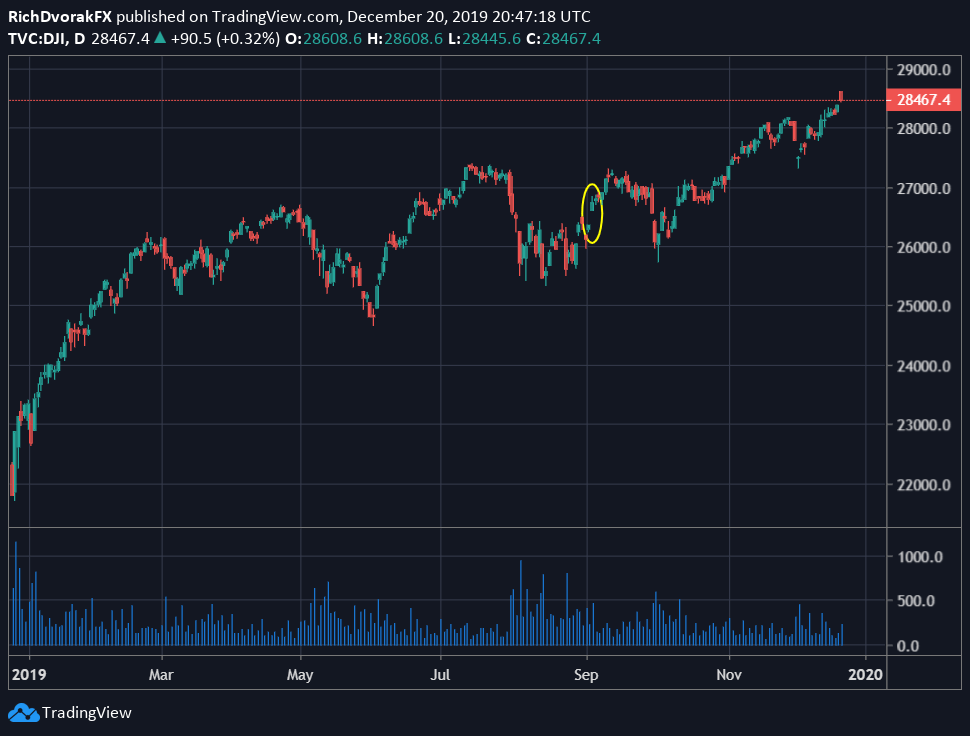
Chart created by @RichDvorakFX with TradingView
The Dow Jones was also quite volatile throughout 2019 as equity investors grappled with tariff whiplash from Washington and Beijing and President Trump’s twitter account.
One bullish turning point in the stock market’s euphoric rally this year was the Dow’s massive gap higher on September 05 as risk assets surged on US-China trade war optimism.
| Change in | Longs | Shorts | OI |
| Daily | 7% | -6% | -1% |
| Weekly | -25% | 7% | -8% |
The benchmark of blue-chip stocks has proceeded to climb another 7% since as Sino-American trade tensions ease, but another global volatility breakout could be around the corner as US-China trade deal hope runs amok.
CRUDE OIL SUPPLY SHOCK AMID SAUDI OIL PIPELINE ATTACK – 16 SEPTEMBER 2019

Chart created by @RichDvorakFX with TradingView
Another memorable episode of volatility witnessed by traders during 2019 was the 15% gap higher in crude oil prices printed on September 16 in response to the oil supply shock resulting from the drone attack on a major Saudi pipeline.
Geopolitical factors – such as OPEC production quotas or tension in the Middle East and other major oil producing countries – highlights a major risk surrounding crude oil prices with potential of spurring volatility.

Although, it is worth noting that the commodity dropped nearly 20% over the subsequent 11 trading days as slowing global GDP growth headwinds strong-armed the price of crude oil lower.
BRITISH POUND SPIKES AS VARADKAR SEES BREXIT DEAL PATH – 10 OCTOBER 2019

Chart created by @RichDvorakFX with TradingView
Various measures of currency volatility have plunged to multi-year lows during 2019. GBP price action this year certainly is an exception to that generalization as forex traders send the Pound Sterling whipsawing in response to the latest Brexit developments.
While there have been many unforgettable moments in UK Parliament over the last several months that provided serious doses of volatility to the British Pound, the surge in GBP prices on October 10 stands out in particular.

This jump in the British Pound – owing to headlines that Irish PM Leo Varadkar hinted at a Brexit deal pathway – marked the onset of the Sterling’s 11% ascent to its December 12 post- general election results peak.
-- Written by Rich Dvorak, Junior Analyst for DailyFX.com
Connect with @RichDvorakFX on Twitter for real-time market insight


