USD/MXN Highlights:
- USD/MXN big-picture triangle breaking to the downside
- Could be a fake-out but running with what is immediately presented
- Breakout in volatility could be a good omen for FX volatility in general
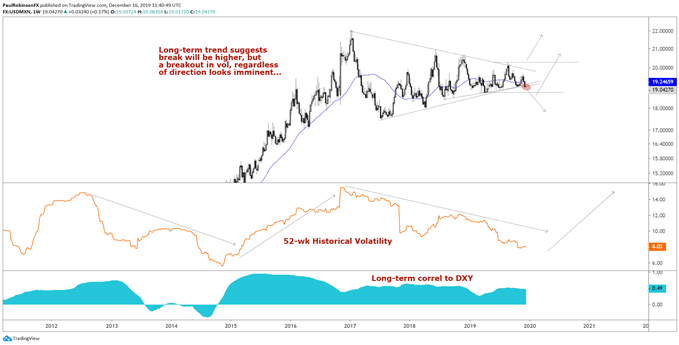
Less than two weeks ago I was discussing the backdrop for a volatility breakout in the US Dollar versus the Mexican Peso, and as of last week USD/MXN is starting to break down out of the macro-wedge dating back to the beginning of 2017.
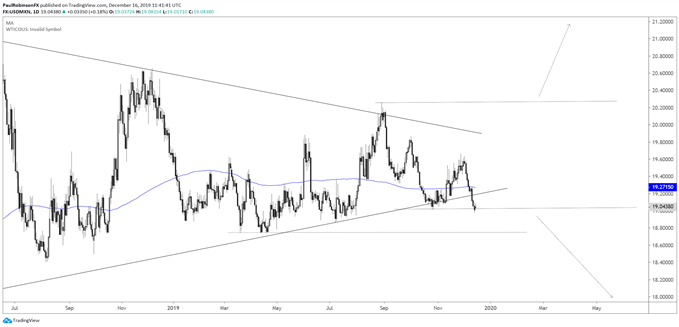
The break that started last week has only been minor thus far, with price just starting to poke through the underside trend-line of the pattern and probing the October low. This slight breach isn’t yet making for a compelling breakout, and with us moving closer to the end of the year we may not see momentum come in until the calendar flips.
There is still a good chance that the initial breakout will be a false one, as these types of patterns (symmetrical triangles) are known to have a ‘fake-break’ or two around the apex before finding a sustainable direction.
Even with that being the case, it is a good idea to take what the market presents immediately in front of us when it comes to these things, and be ready for an alternate scenario to play out should the cards start to turn that way. For now, some separation below 19 will help strengthen the bear case.
An inability to continue to sustain lower will begin to increase the likelihood we see a reversal higher. In that case, the false breakdown and rally would be in-line with the longer-term trend, but for confirmation to come on the top-side a breakout above 19.94 with force is desired.
Dollar/FX volatility has been on a major decline these past few years, leading the US Dollar Index towards finishing 2019 with the smallest annual trading range since 1976. The USD/MXN chart highlights this crunch in volatility, and it starting to jostle itself free looks like a major silver lining for FX volatility as we head into 2020.


USD/MXN Weekly Chart (regardless of how it unfolds, looking for volatility to pick up)

USD/MXN Daily Chart (needs to weaken a bit more and get some clearance)

***Updates will be provided on the above thoughts and others in the trading/technical outlook webinars held at 1030 GMT on Tuesday and Friday. If you are looking for ideas and feedback on how to improve your overall approach to trading, join me on Thursday each week for the Becoming a Better Trader webinar series.
Resources for Forex & CFD Traders
Whether you are a new or experienced trader, we have several resources available to help you; indicator for tracking trader sentiment, quarterly trading forecasts, analytical and educational webinars held daily, trading guides to help you improve trading performance, and one specifically for those who are new to forex.
---Written by Paul Robinson, Market Analyst
You can follow Paul on Twitter at @PaulRobinsonFX


