


USD/JPY, NIKKEI 225 OUTLOOK – Talking Points:
- USD/JPY, Nikkei 225 have risen with Fed policy bets for three months
- Technical positioning hints US Dollar may have topped against the Yen
- Nikkei 225 threatening key support as candle pattern hints at reversal

Japan’s Nikkei 225 stock index has traded higher alongside USD/JPY and the rate futures-implied outlook for 2020 Fed monetary policy for close to three months. The equities benchmark joined a host of risk-on assets in a move reflecting swelling hopes for a US-China trade deal and an orderly Brexit. That understandably reduced the perceived scope for Fed rate cuts. The perennially anti-risk Yen dutifully fell.
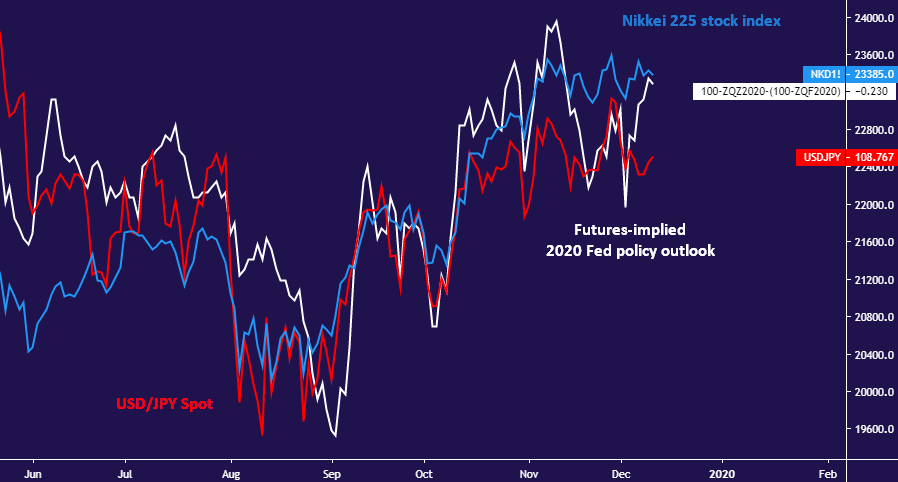
Chart created with TradingView
Technical positioning warns that these moves may be approaching exhaustion. USD/JPY recoiled from resistance guiding it lower since October 2018 to complete a bearish Falling Wedge chart formation. Prices have paused to digest at initial support in the 108.35-48 zone. A daily close below that may set the stage for a push through minor support at 107.89 to challenge the 106.78-107.21 zone.
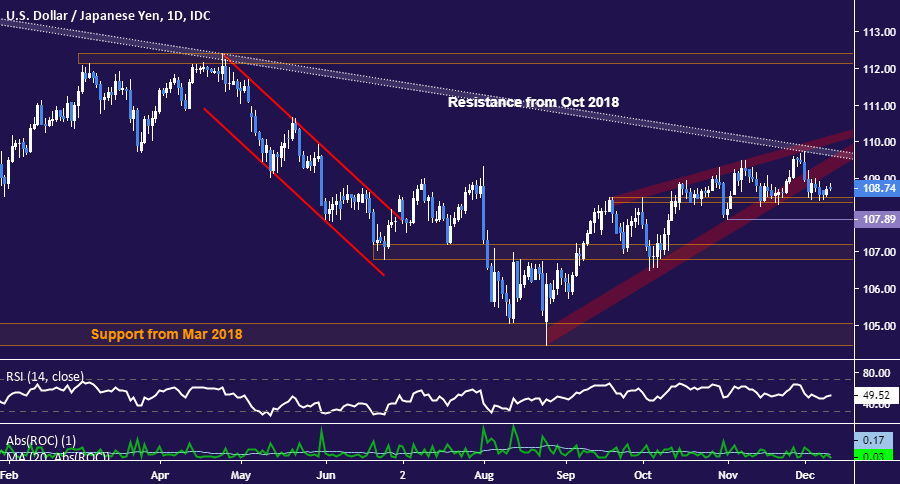
USD/JPY chart created with TradingView
Meanwhile, the Nikkei 225 is showing signs of topping with the formation of a Bearish Engulfing candlestick pattern at resistance in the 23625-60 region. A daily close below the 23000 figure would breach immediate support as well as the bounds of the three-month uptrend, suggesting change of trend is afoot. If this plays out, initial support levels line up at 22505 and 22120 thereafter.
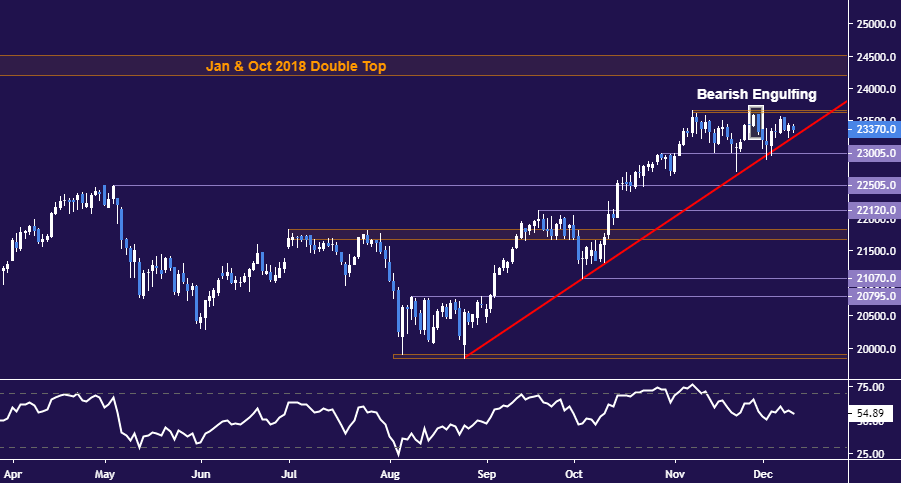
Nikkei 225 chart created with TradingView
USD/JPY, NIKKEI 225 TRADING RESOURCES
- Just getting started? See our beginners’ guide for FX traders
- Having trouble with your strategy? Here’s the #1 mistake that traders make
- Join a free webinar and have your questions answered
--- Written by Ilya Spivak, Currency Strategist for DailyFX.com
To contact Ilya, use the comments section below or @IlyaSpivak on Twitter


