


Natural Gas Technical Analysis
- Natural gas price action
- Nat gas Charts
Did we get it right with our Gold and Crude Oil forecasts? Find out more for free from Q4 main currencies and commodities forecasts
Natural Gas – Sellers Hold Fire
On Friday, downside move led natural gas towards $2.258- its lowest level in eight weeks. The weekly candlestick closed with a 14.3% loss. This week, the price rallied as some sellers took profit and exited market.
The relative Strength Index (RSI) rose from 30 to 42 then remained flat reflecting a weaker downtrend momentum.
Having trouble with your trading strategy? Here’s the #1 Mistake That Traders Make
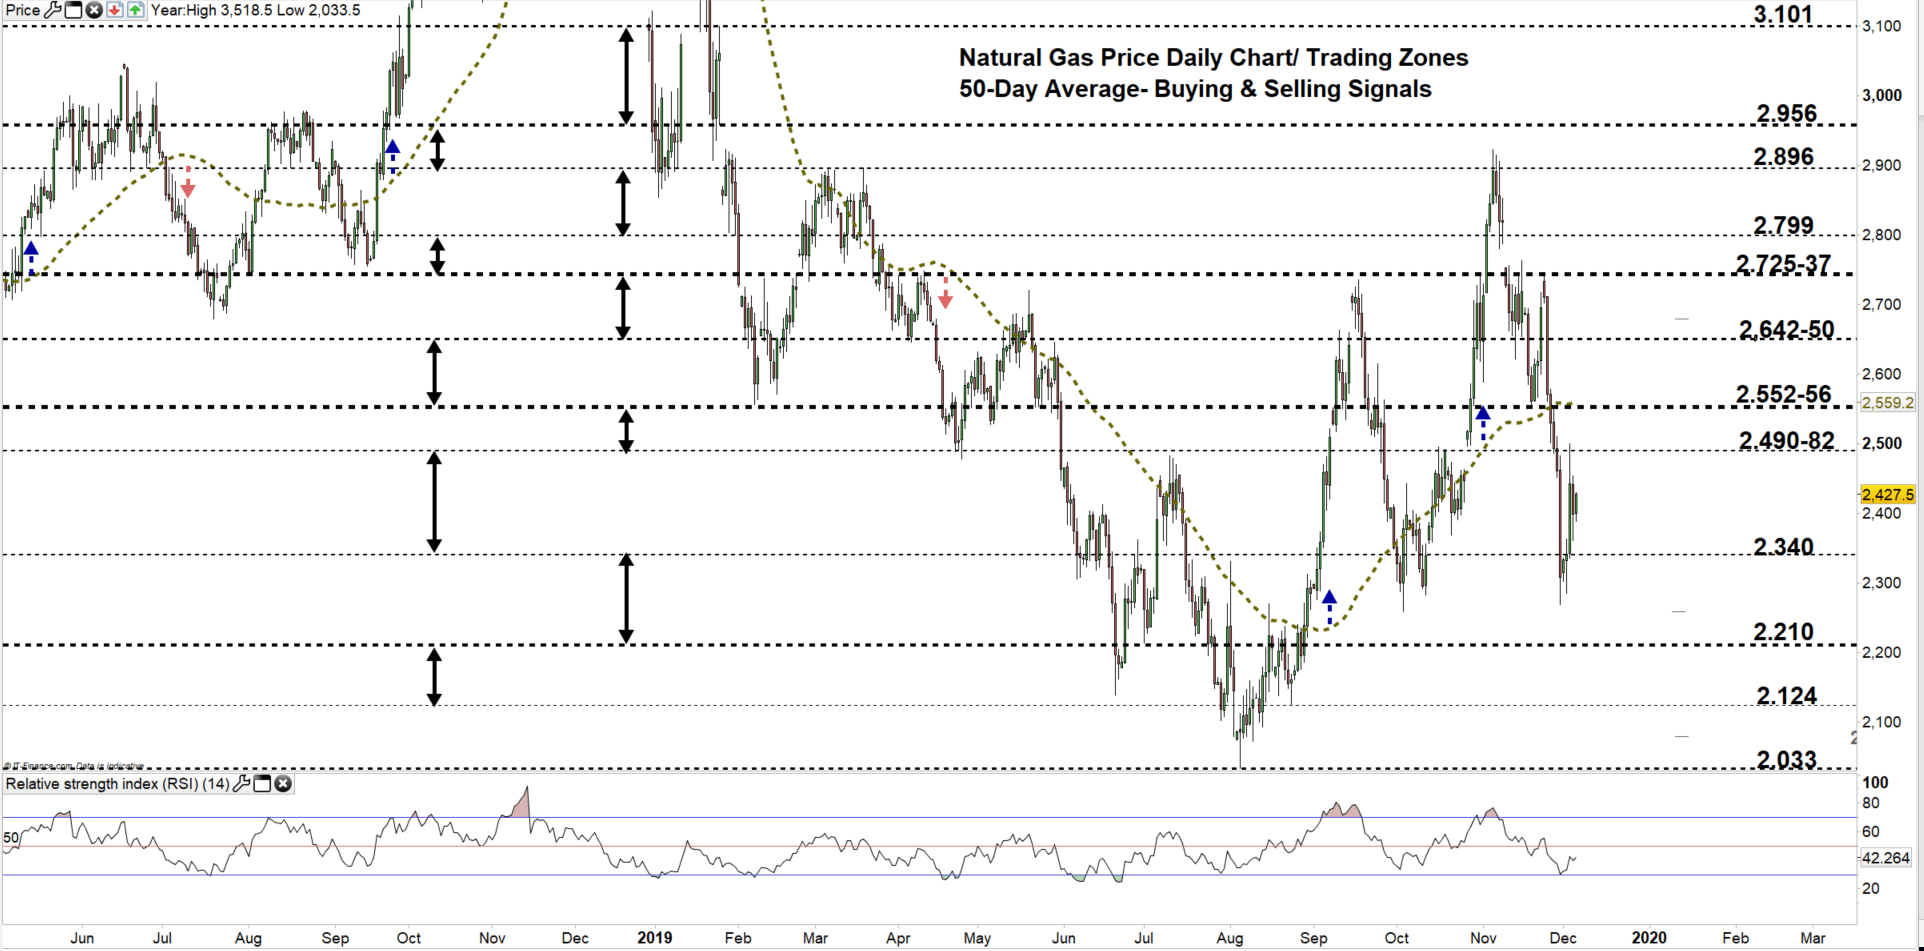
Nat-Gas DAILY Price CHART (May 15, 2018 – DEC 5, 2019) Zoomed Out
Nat-Gas DAILY Price CHART (AUg 1 – DEC 5, 2019) Zoomed IN
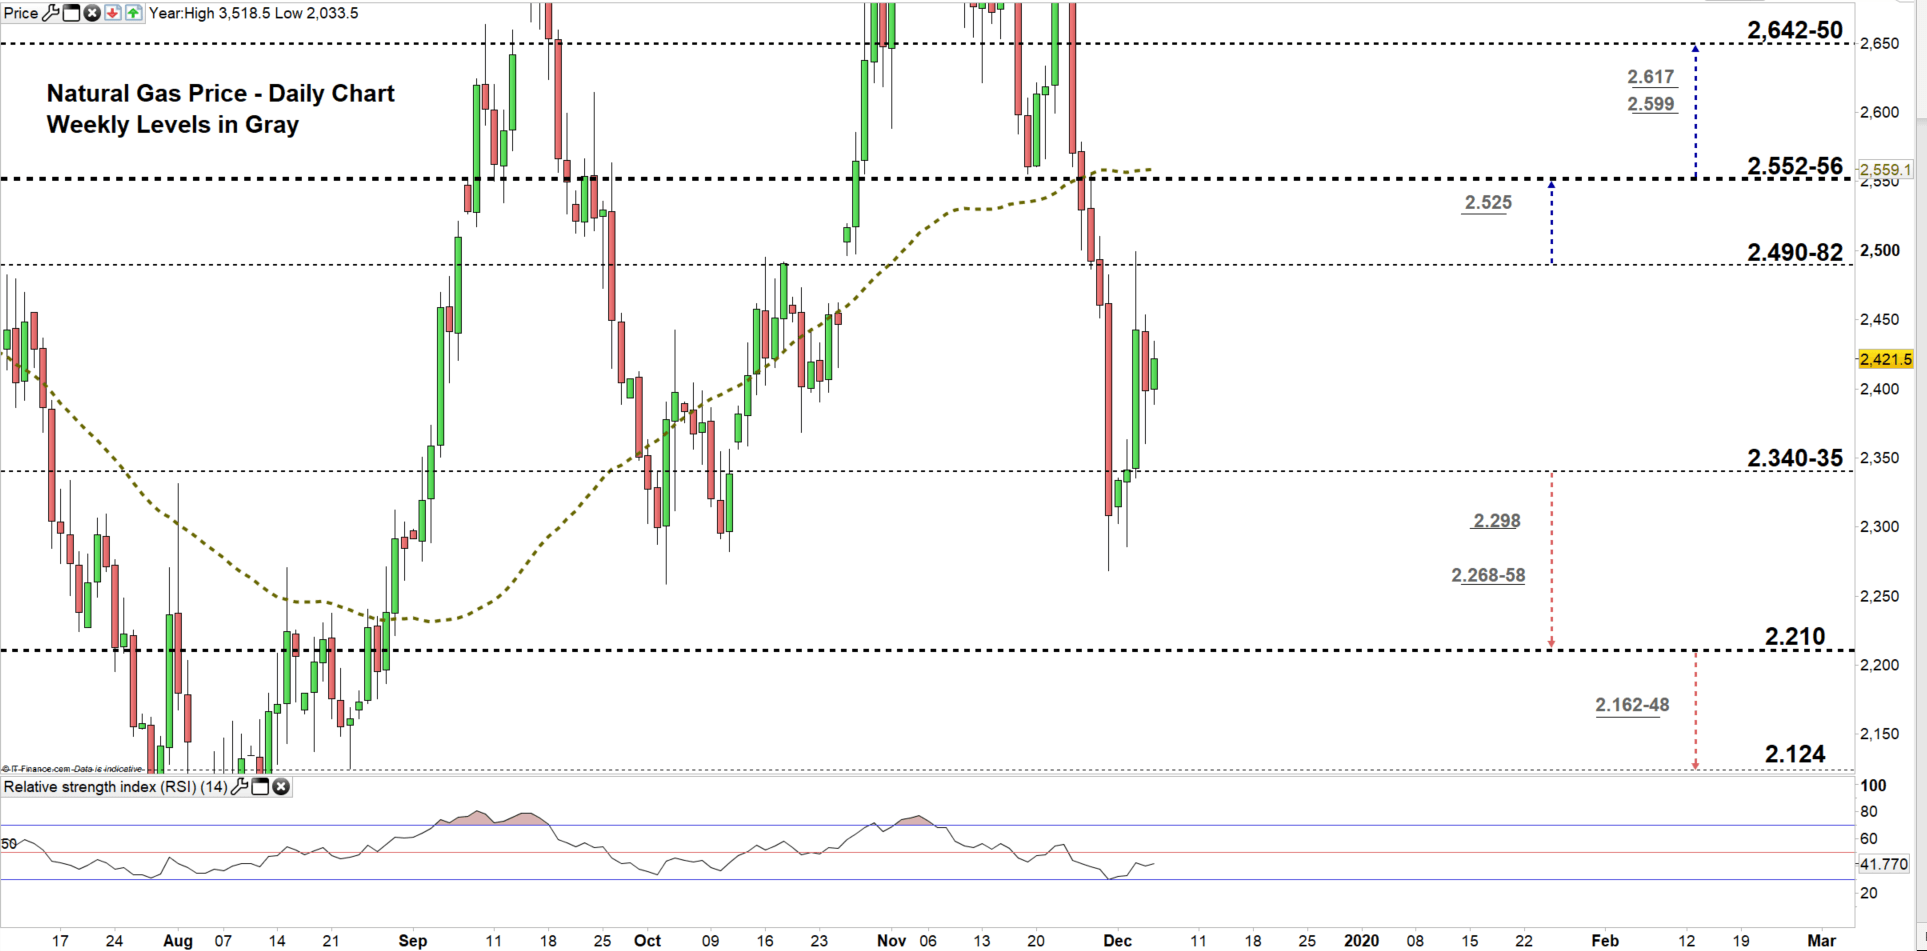
Looking at the daily chart, we notice at the start of the week natural gas entered a higher trading zone $2.340- $2.490. On the following day, the price tried to rally to the next zone however, natural gas reverted back to the zone as some buyers took profits.
Thus, a close below the low end of the zone could offer sellers the opportunity to take charge and press natural gas towards $2.210. Further close below this level could embolden more sellers to join the market and lead the price towards $2,124. In that scenario, a special attention needs to be paid to the weekly support level and areas marked on the chart (zoomed in) as some sellers could take profit at these points.
On the flip-side, a close above the high end of the zone may push the price towards the vicinity $2.552-56. Further close above this area could entice market’s participants to rally the price towards the vicinity of $2.642-50. That said, the weekly resistance levels underlined on the chart should be considered.
Just getting started? See our Beginners’ Guide for FX traders
Natural Gas price Four-Hour PRICE CHART (Nov 5 – DEc 5, 2019)
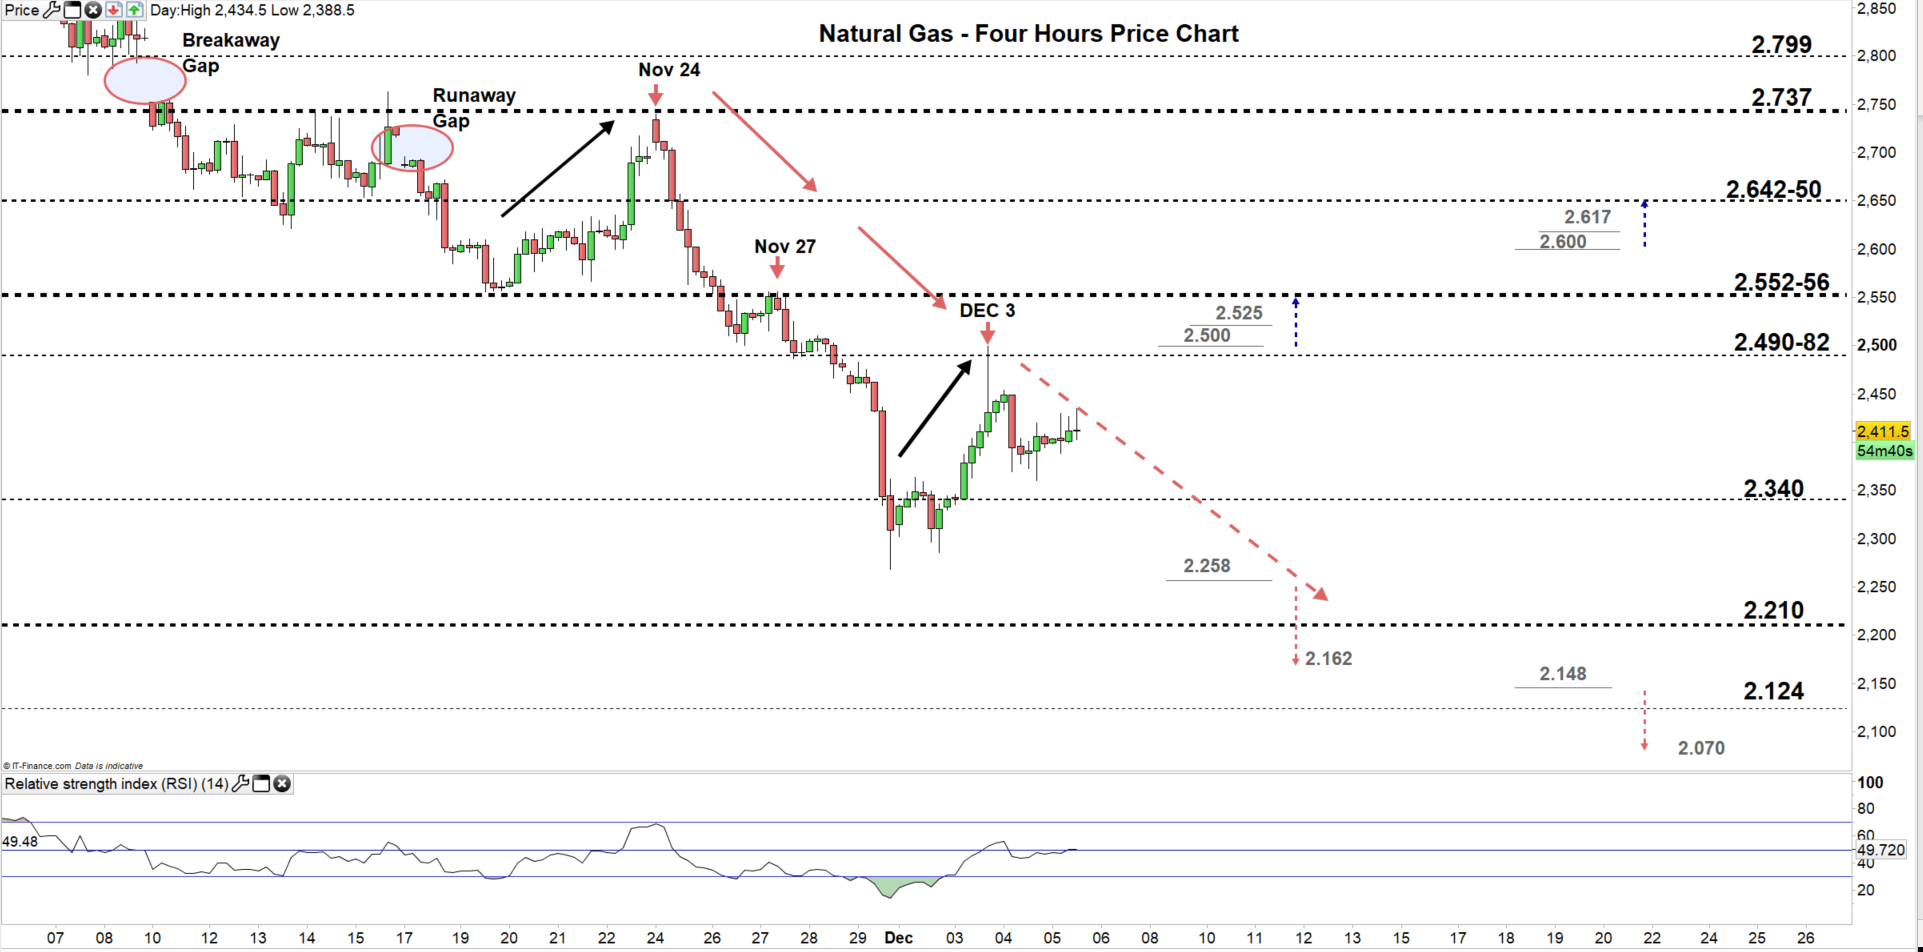
From the four- hour chart, we notice on Nov 10 natural gas started a downtrend move as opened with breakaway gap then followed in the week after with a runaway gap. On Nov 27, the price rebounded from $2.555 in multiple occasions and this accelerated downtrend move causing more losses. On Dec 3, natural gas failed to clear $2.500 handle.
Thus, a break below $2.258 could resume bearish price action towards $2.162. Although, the support level marked at $2.210 should be kept in focus. On the flipside, a successful break above $2.500 handle could push natural gas towards the vicinity of $2.552-56. Nevertheless, the weekly resistance level underlined on the chart would be worth monitoring.
See the chart to know more about key levels to monitor in a further bullish/bearish move.
Join Me on Friday, Dec 6 at 14:00 GMT. In this session we will talk about common directional and momentum indicators and how to use them
Written By: Mahmoud Alkudsi
Please feel free to contact me on Twitter: @Malkudsi


