


USD/JPY, NIKKEI 225 Technical Analysis – Talking Points:
- USD/JPY chart setup hints downtrend resumption may be ahead
- Rising Wedge pattern, negative RSI divergence offer bearish cues
- Signs of topping on Nikkei 225 stock index bolster downside bias
Where will markets end 2019? See our Q4 forecasts for currencies, commodities and stock indexes !
The Japanese Yen may be preparing to turn higher against the US Dollar. Price action leading the bellwether USD/JPY exchange rate into a test of resistance guiding it lower since October 2018 has formed a bearish Rising Wedge chart pattern, warning that a turn lower is in the cards.
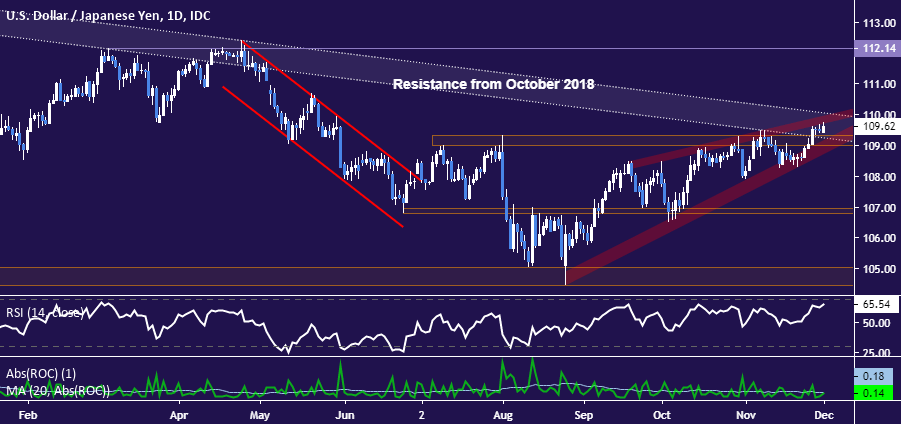
USD/JPY chart created with TradingView
Nearer-term positioning seems to cautiously bolster a downside bias. Zooming in to the four-hour chart reveals negative RSI divergence as prices test the Rising Wedge pattern’s upper boundary, speaking to ebbing upside momentum. This might precede the formation of a top (though confirmation is still absent).
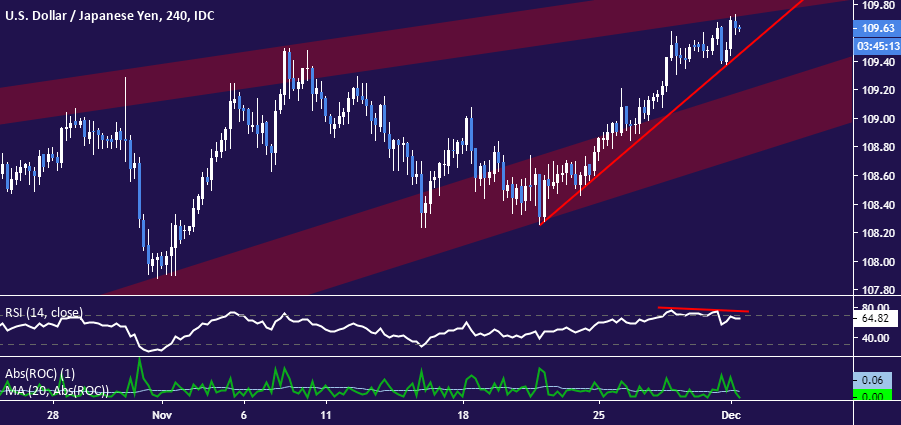
USD/JPY chart created with TradingView
Japan’s benchmark Nikkei 225 stock index offers further reinforcement. A Bearish Engulfing candlestick pattern hints a double top in the 23625-60 area may be taking shape. Closing below 23005 would serve as initial confirmation. Weakness here tends to bode well for the anti-risk Japanese currency.

Nikkei 225 chart created with TradingView
USD/JPY, NIKKEI 225 TRADING RESOURCES
- Just getting started? See our beginners’ guide for FX traders
- Having trouble with your strategy? Here’s the #1 mistake that traders make
- Join a free webinar and have your questions answered
--- Written by Ilya Spivak, Currency Strategist for DailyFX.com
To contact Ilya, use the comments section below or @IlyaSpivak on Twitter


