


Swedish Krona, Norwegian Krone, US Dollar, Euro, FOMC Minutes – TALKING POINTS
- US Dollar volatility ahead of the release of the FOMC meeting minutes
- USD/SEK, USD/NOK may suffer, pairs may end up testing key support
- EUR/USD flirting with resistance: will FOMC catalyze follow-through?
Learn how to use politicalrisk analysis in your trading strategy!
EUR/USD Technical Analysis
Since the November 14 swing low at 1.0989, EUR/USD has recovered almost one percent and is now testing familiar resistance at 1.1073. Traders may be reluctant to commit capital until after the price barrier is broken with follow-through. The publication of the FOMC meeting minutes may be the fundamental catalyst the pair needs to propel itself beyond this hurdle.
EUR/USD – Daily Chart
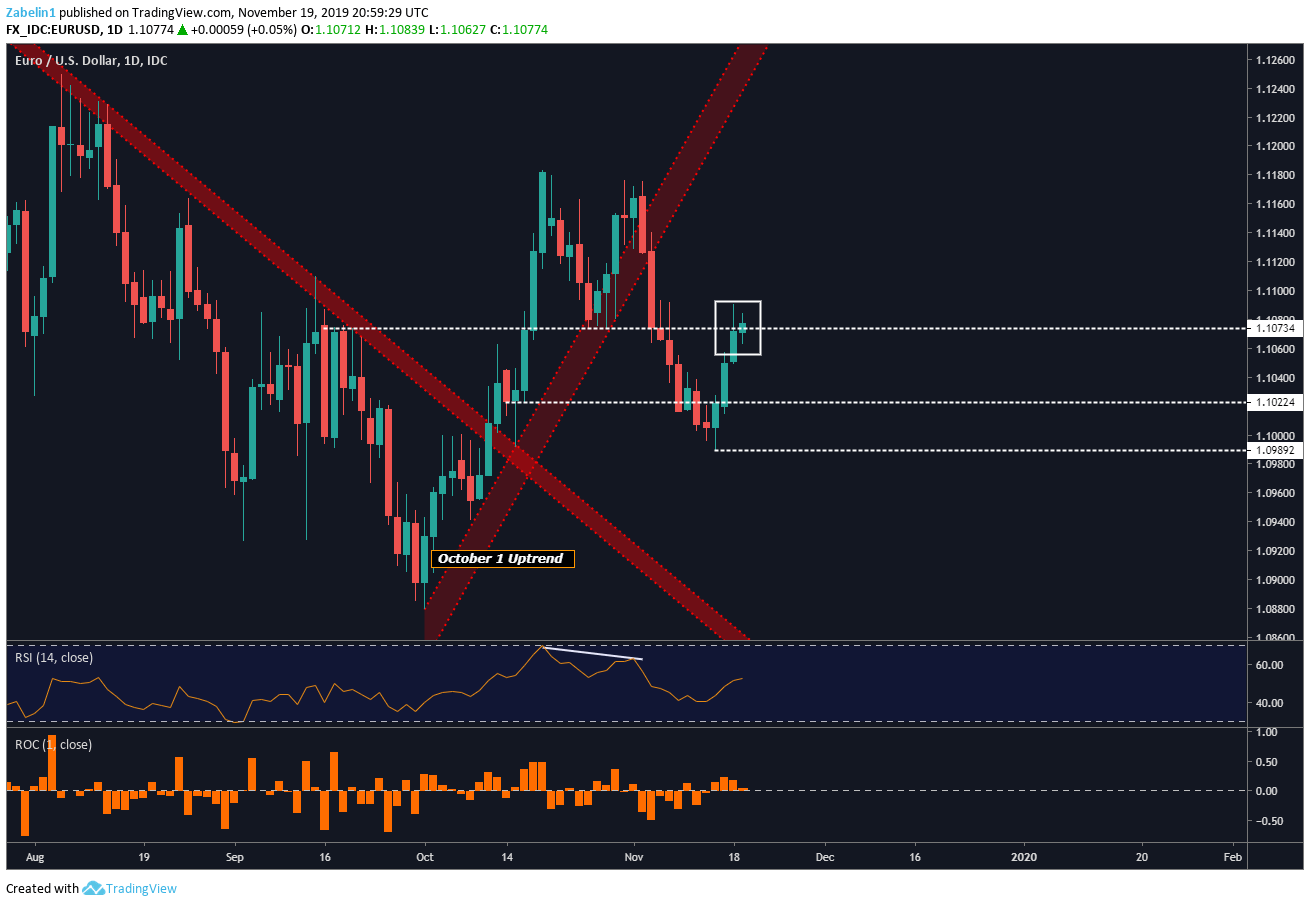
EUR/USD chart created using TradingView
Conversely, a lack of meaningful upside commitment may deter EUR/USD bulls and could see the pair close lower, opening the door to testing support at 1.1022. However, even if the pair is able to break above 1.1073 with confirmation, does the longer-term outlook support a bullish bias for EUR/USD?
The short answer is: it does not appear so. Zooming out to a monthly perspective reveals the pair has been on a steady downtrend for over a decade. The slope of the pair’s descent became particularly sharp in 2018. While it is possible EUR/USD may be able to break above May 2018 resistance, the pair would still have to clear the 10-year descending zone before traders believed a tectonic shift had occurred in its trajectory.
EUR/USD – Monthly Chart
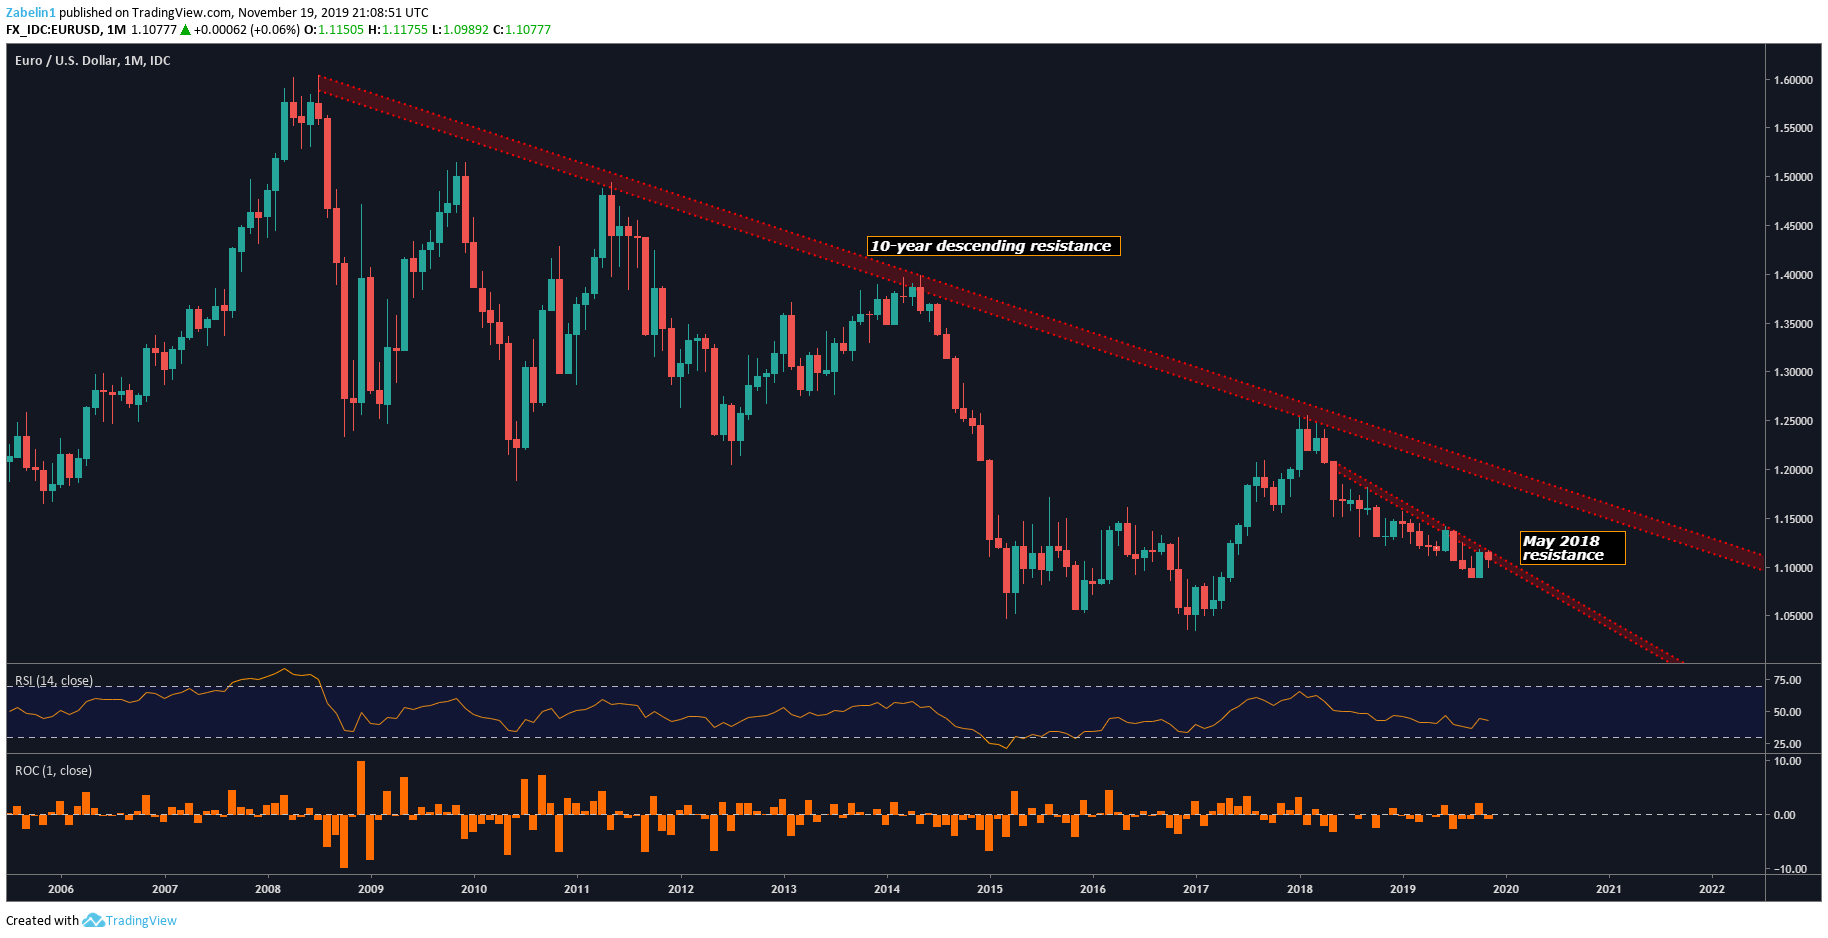
EUR/USD chart created using TradingView
USD/SEK Price Chart
USD/SEK remained little-changed at the end of Tuesday’s session, possibly reflecting traders’ reluctance to commit capital until the FOMC minutes had been published. The pair is currently stuck in the Zone 1 congestive range (see chart below) after failing to clear above the upper bound of the 9.6878-9.7228 resistance area. The pair may aim to test 9.5323 if the FOMC minutes catalyze a US Dollar selloff.
USD/SEK – Daily Chart
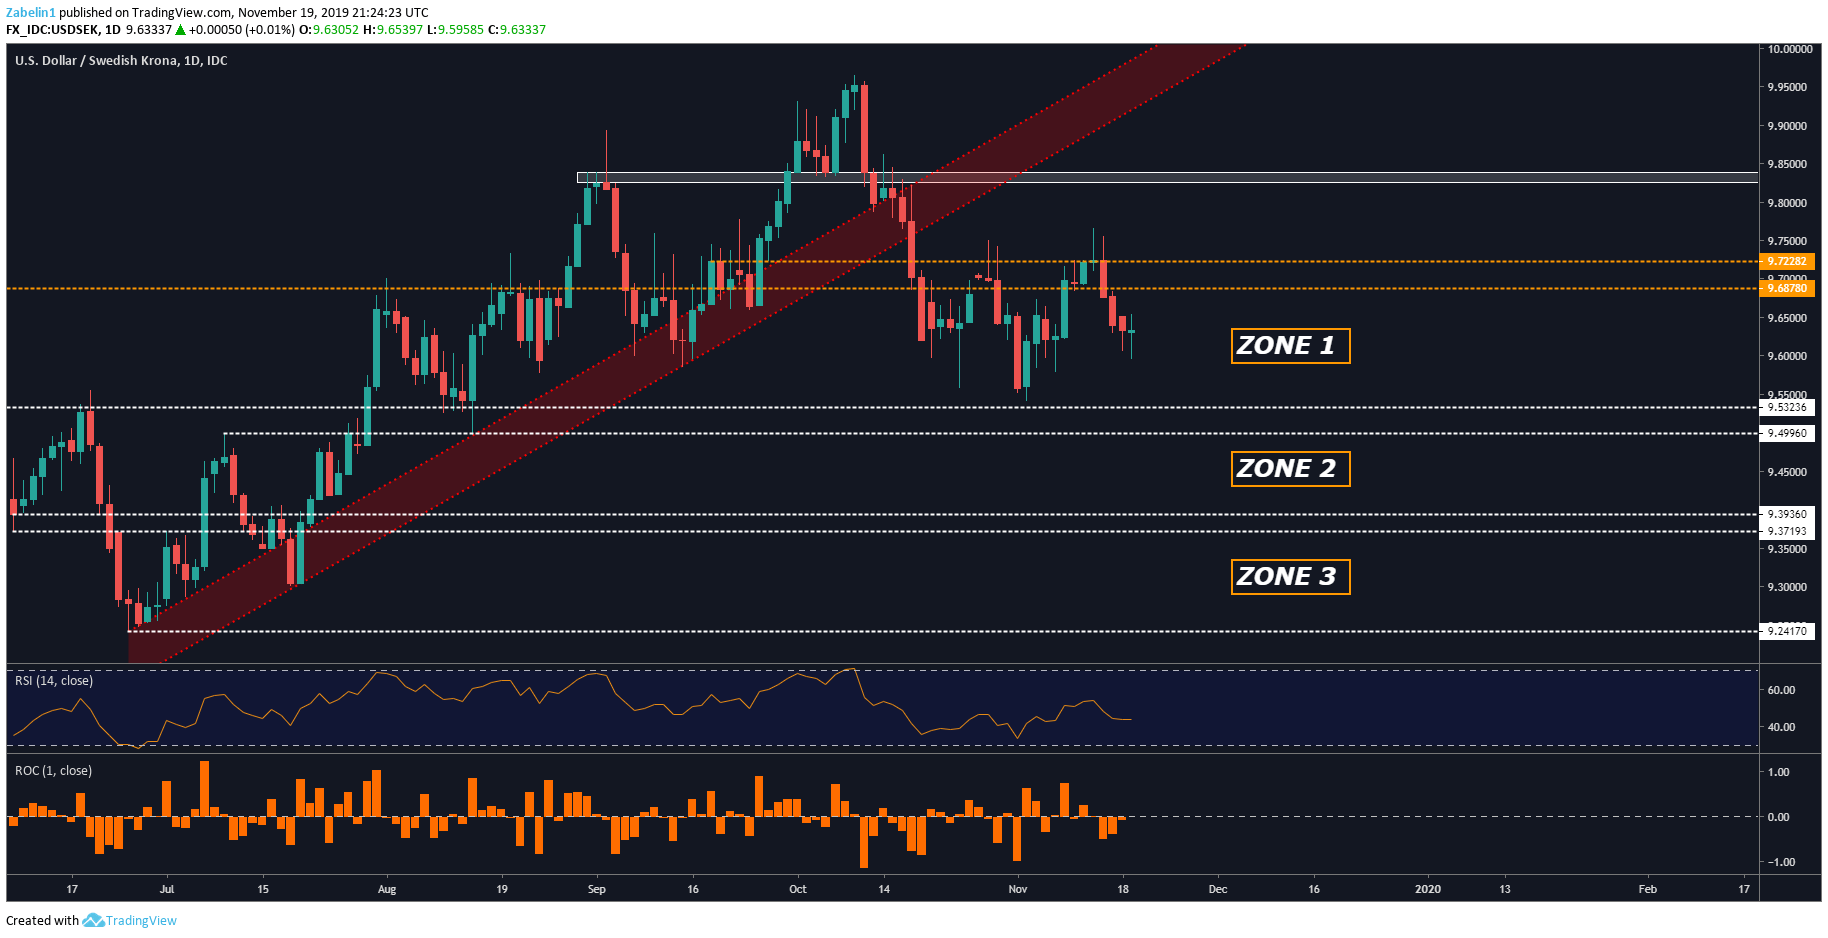
USD/SEK chart created using TradingView
USD/NOK Outlook
Since late-September, USD/NOK has broadly traded sideways but the pair may attempt to break below the 9.0526-9.0713 support range which opens the door to testing key support at 9.0030. A break below the latter could catalyze a significant selloff if traders believe it marks a short-term shift in the pair’s overall trajectory. However, an aggressive decline may be stalled if traders encounter friction at another critical floor at 8.9179.
USD/NOK – Daily Chart
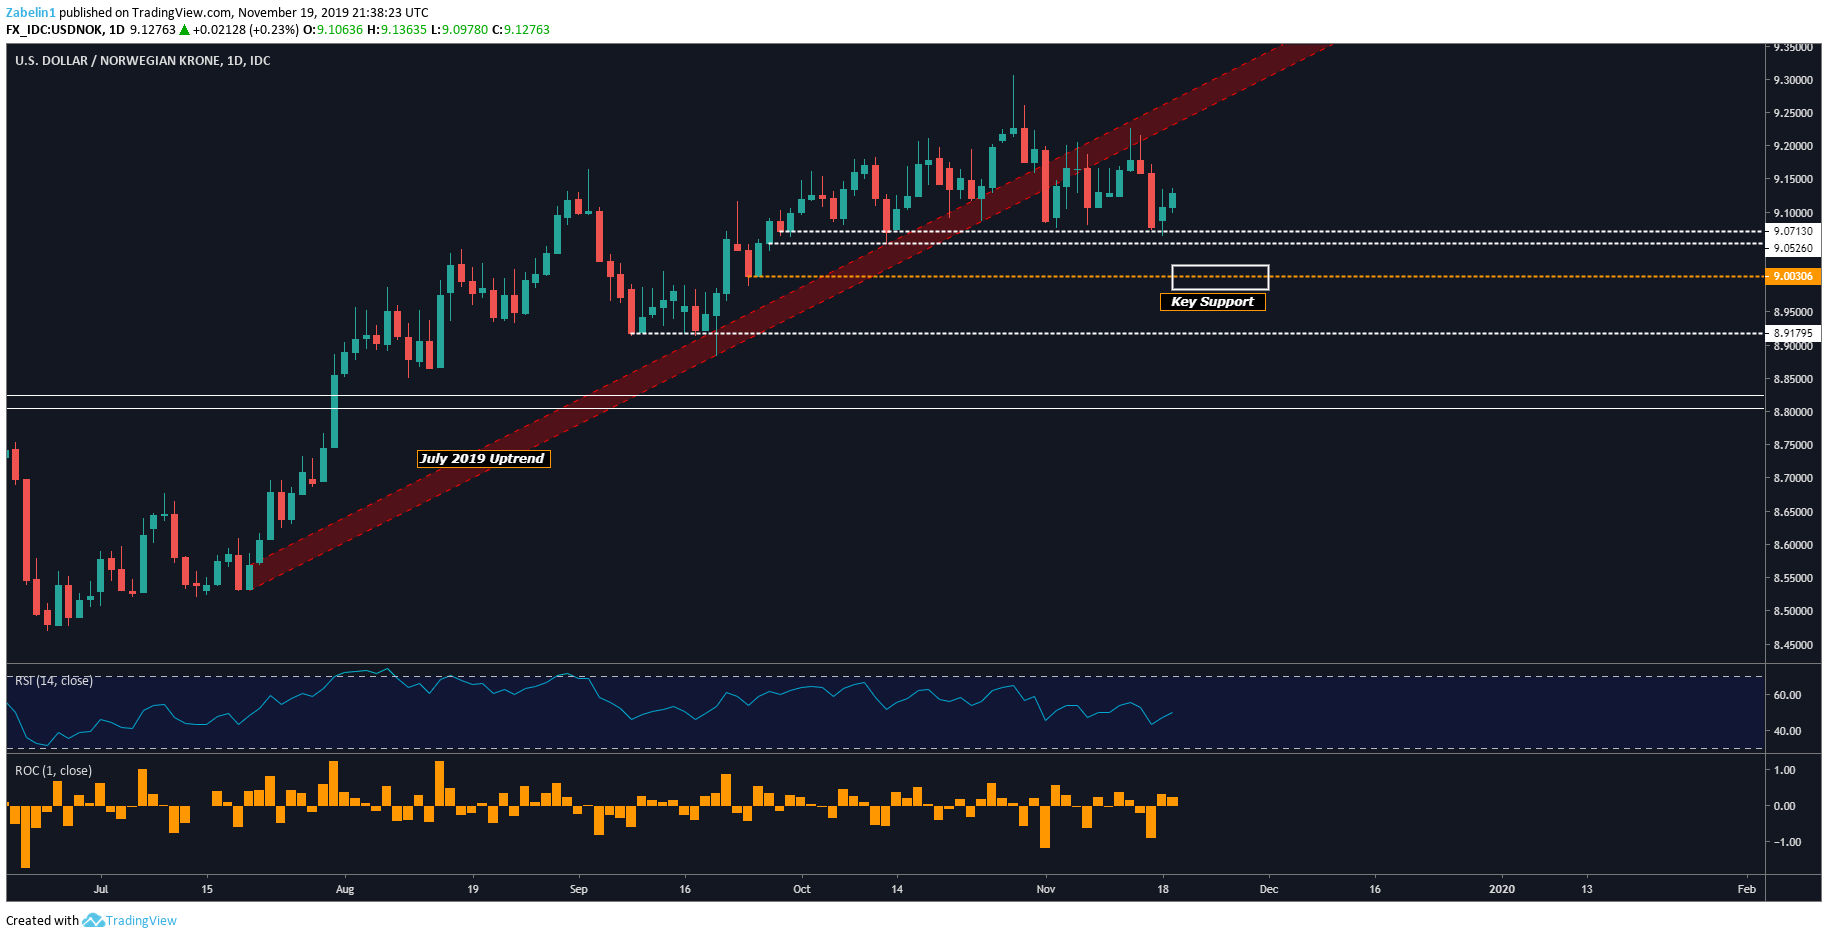
USD/NOK chart created using TradingView
NORDIC FX TRADING RESOURCES
- Join a free webinar and have your trading questions answered
- Just getting started? See our beginners’ guide for FX traders
- Having trouble with your strategy? Here’s the #1 mistake that traders make
--- Written by Dimitri Zabelin, Jr Currency Analyst for DailyFX.com
To contact Dimitri, use the comments section below or @ZabelinDimitri on Twitter


