


Natural Gas Technical Forecast
- Natural Gas price action
- NG Charts and analysis
Did we get it right with our Gold and Crude Oil forecasts? Find out more for free from Q4 main currencies and commodities forecasts
Natural Gas – Buyers in Charge
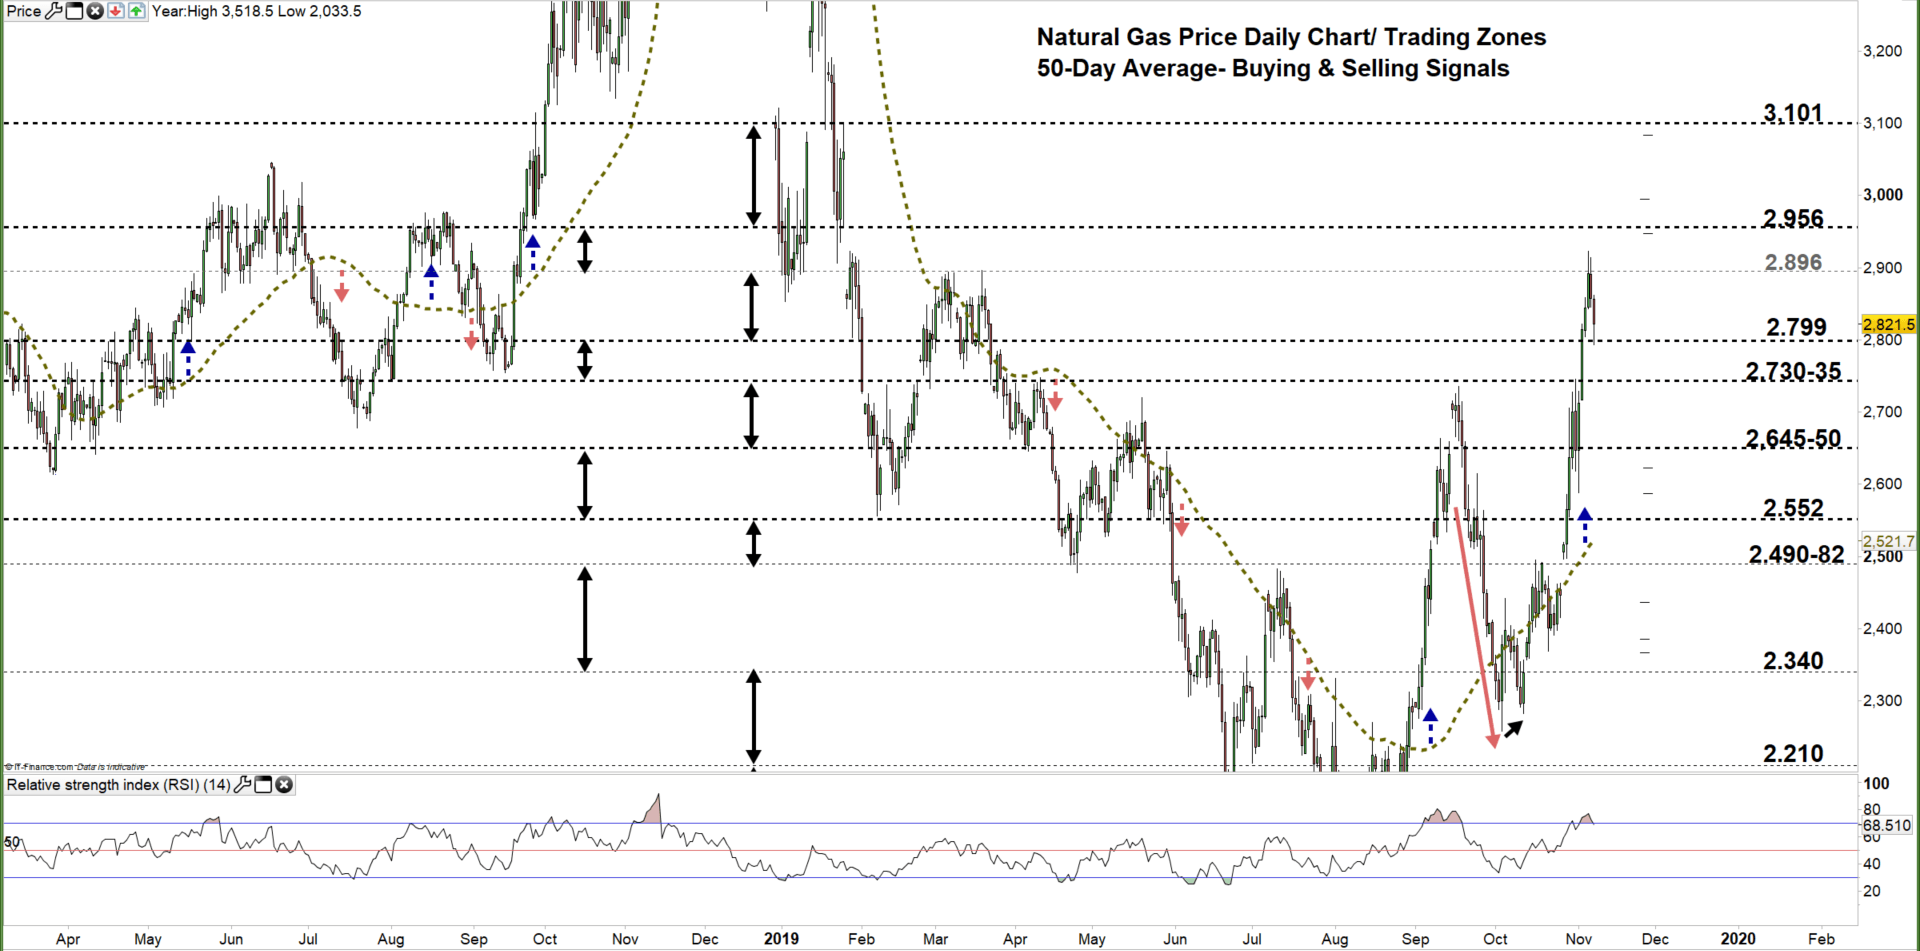
On Oct 31, Natural gas’s uptrend led the price to break above the Sep 17 high at $2.735. This week, the uptrend accelerated and pushed the price on Tuesday towards a new high at $2.922 – highest printed level in over nine months.
Alongside this, the relative Strength Index (RSI) on Nov 1, crossed above 70 and remained in overbought territory indicating to buyer’s domination at this stage.
Having trouble with your trading strategy? Here’s the #1 Mistake That Traders Make
Nat-Gas DAILY Price CHART (Jan 15, 2018 – Nov 7, 2019) Zoomed Out
Nat-Gas DAILY Price CHART (Aug 27 – Nov 7, 2019) Zoomed IN
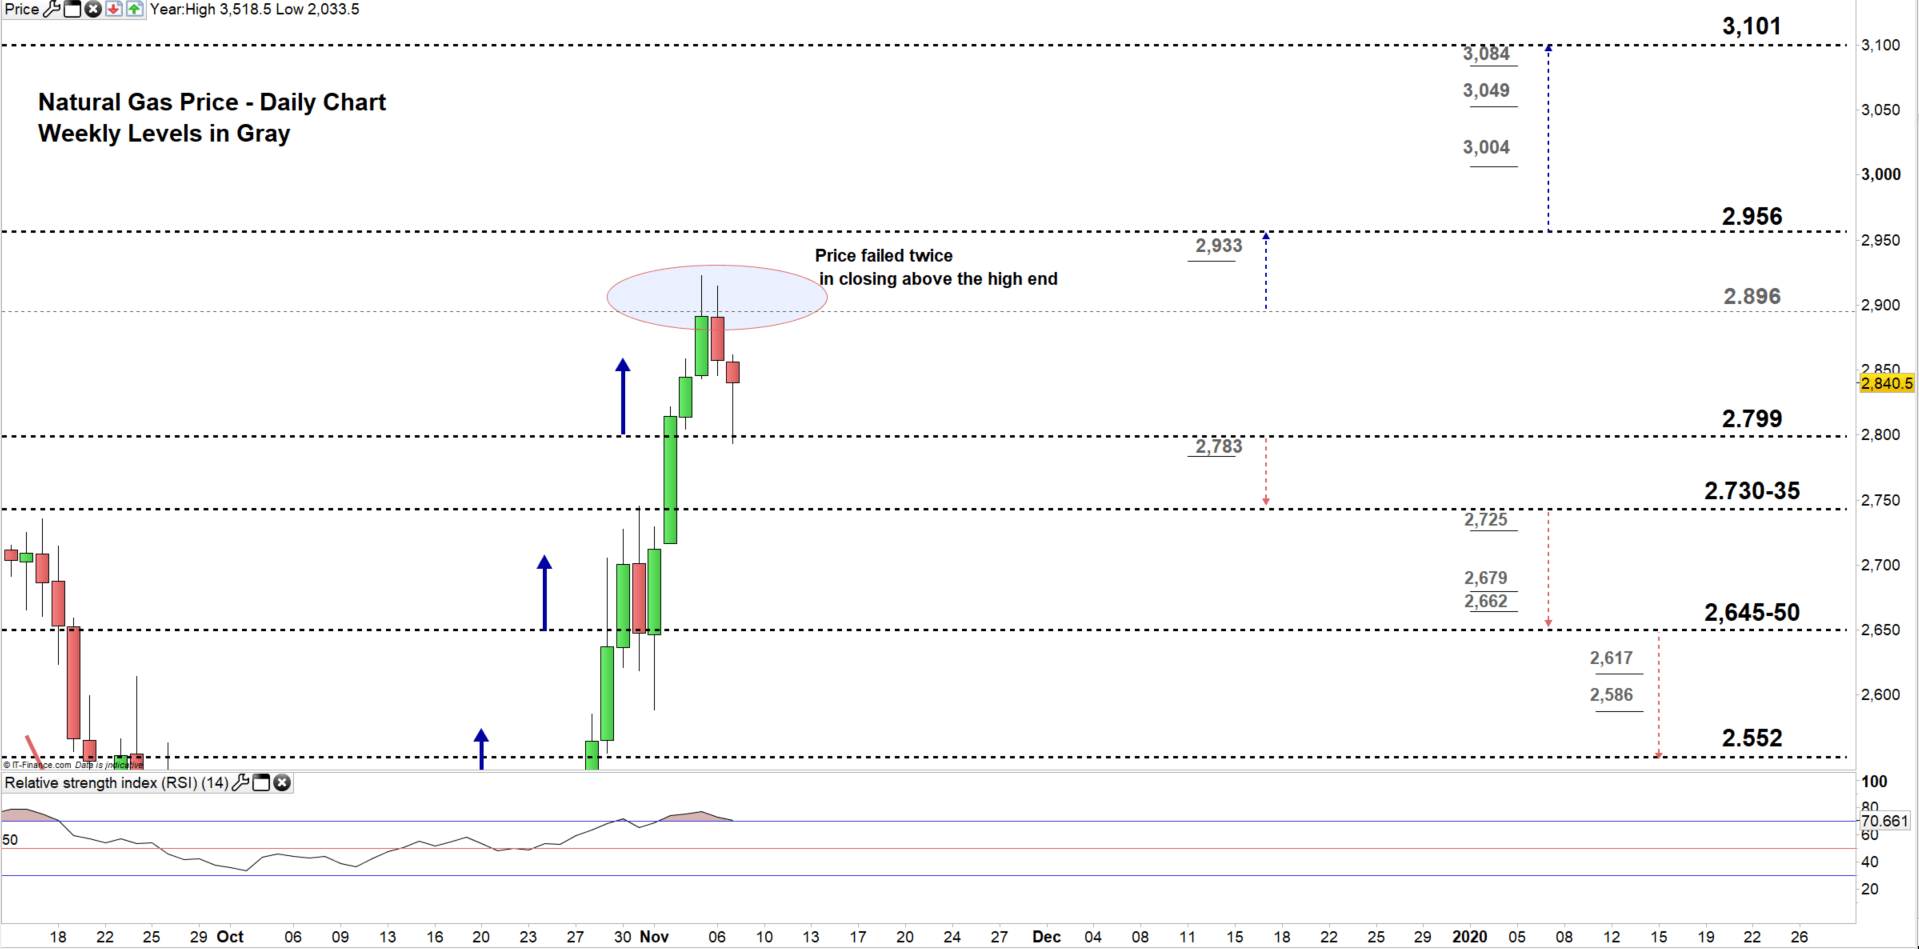
Looking at the daily chart, we notice on Monday, the price moved to a higher trading zone $2.799 - $2.896. However, natural gas failed twice this week to move to the following higher zone. This caused the price to revert its direction towards the low end of the zone.
Hence, a close above the low end of the zone could push natural gas towards the high end. Further close above the high end could see the price trading even higher towards $2.956. Although, the weekly resistance level underlined on the chart (zoomed in) should be monitored.
In turn, a close below the low end of the zone could press natural gas towards the vicinity of $2.735-30. Further close below $2.730 could cause more bearishness towards the vicinity of $2.650-45. In that scenario, sellers need to keep an eye on the weekly support levels underscored on the chart.
Just getting started? See our Beginners’ Guide for FX traders
Natural Gas price Four-Hour PRICE CHART (Sep 17 – Nov 7, 2019)
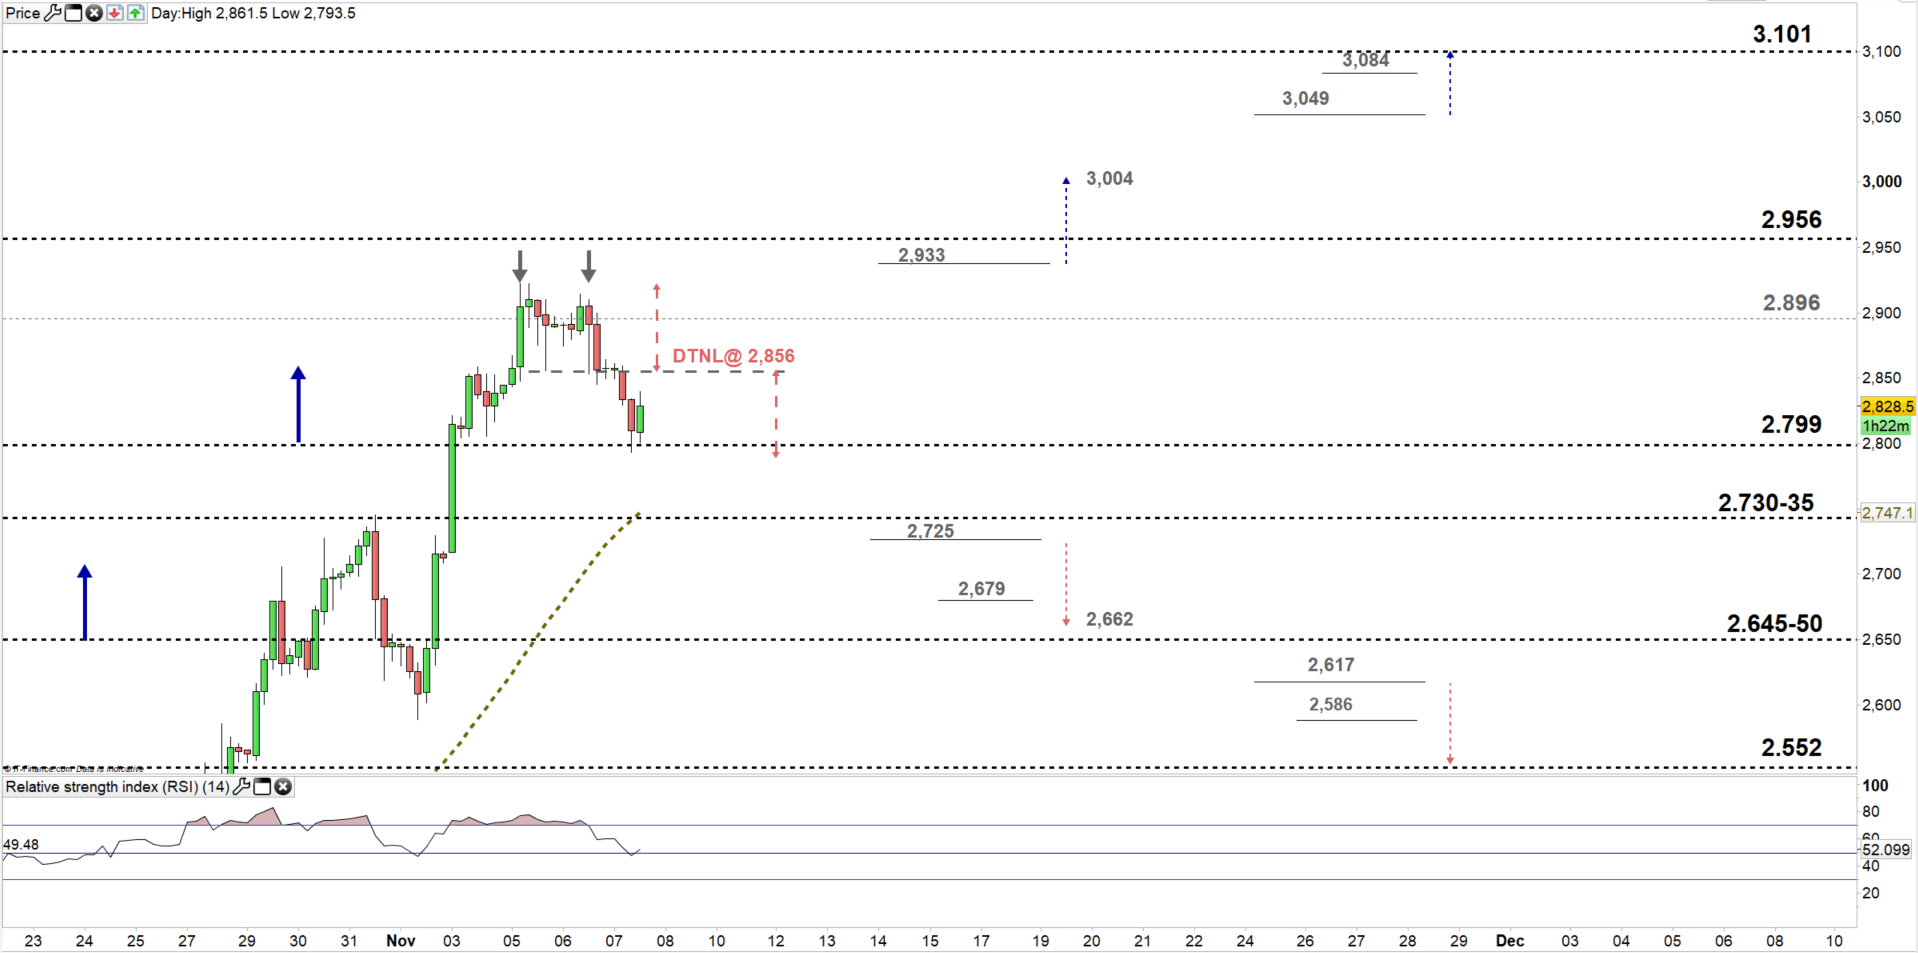
From the four- hour chart, we notice today Natural gas broke below the neckline of double top pattern located at $2.856. The price rebounded from the pattern’s target slightingly below the low end of the discussed trading zone above on the daily chart.
Thus, sellers could take the lead if natural gas breaks below $2.725. This could send the price towards $2.662. Although, the weekly support level underlined on the chart should be considered.
On the other hand, buyers could resume bullish price action if natural gas breaks above $2.933 hinting towards $3.004. Nevertheless, the weekly level marked at $2.956 should be watched closely.
See the chart to know more about key levels to monitor in a further bullish/bearish move.
Join Me on Friday, Nov 8 at 14:00 GMT. In this session we will talk about most common reversal patterns and how to trade them.
Written By: Mahmoud Alkudsi
Please feel free to contact me on Twitter: @Malkudsi


