


US Dollar Chart Analysis, USD/KRW, South Korean Won –TALKING POINTS
- USD/KRW has broken 8-month rising support; what next?
- Weekly chart shows pair is challenging critical 2018 floor
- Longer-term outlook suggests bearish reversal is evolving
Learn how to use political-risk analysis in your trading strategy !
Last week, USD/KRW broke through eight-month rising support and is now aiming at a possible floor at 1153.01. The pair’s decline appears to come less from strength in the South Korean Won and more from overall weakness in the US Dollar. In fact, year-to-date, KRW is the worst-performing Asian currency.
USD/KRW – Daily Chart
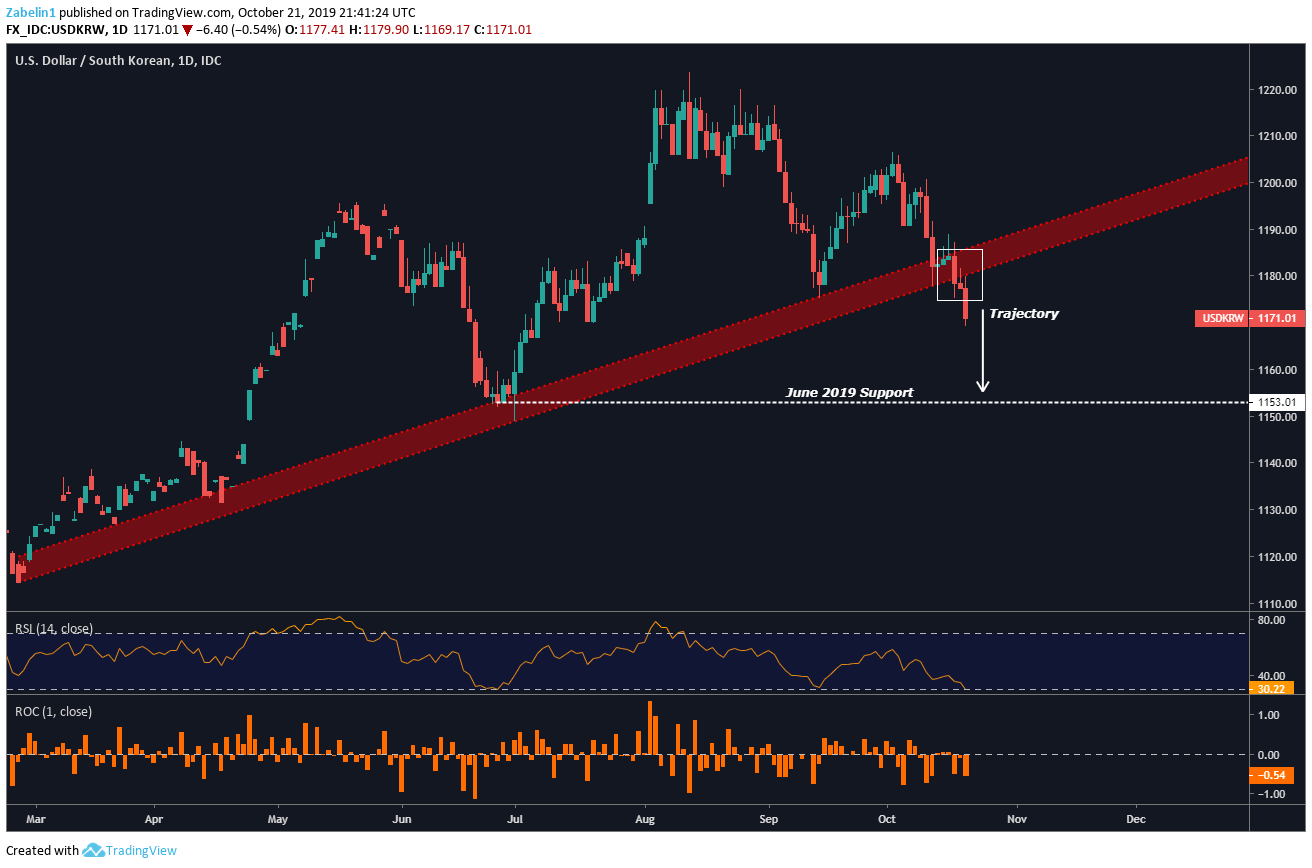
USD/KRW chart created using TradingView
US Dollar Index – Daily Chart
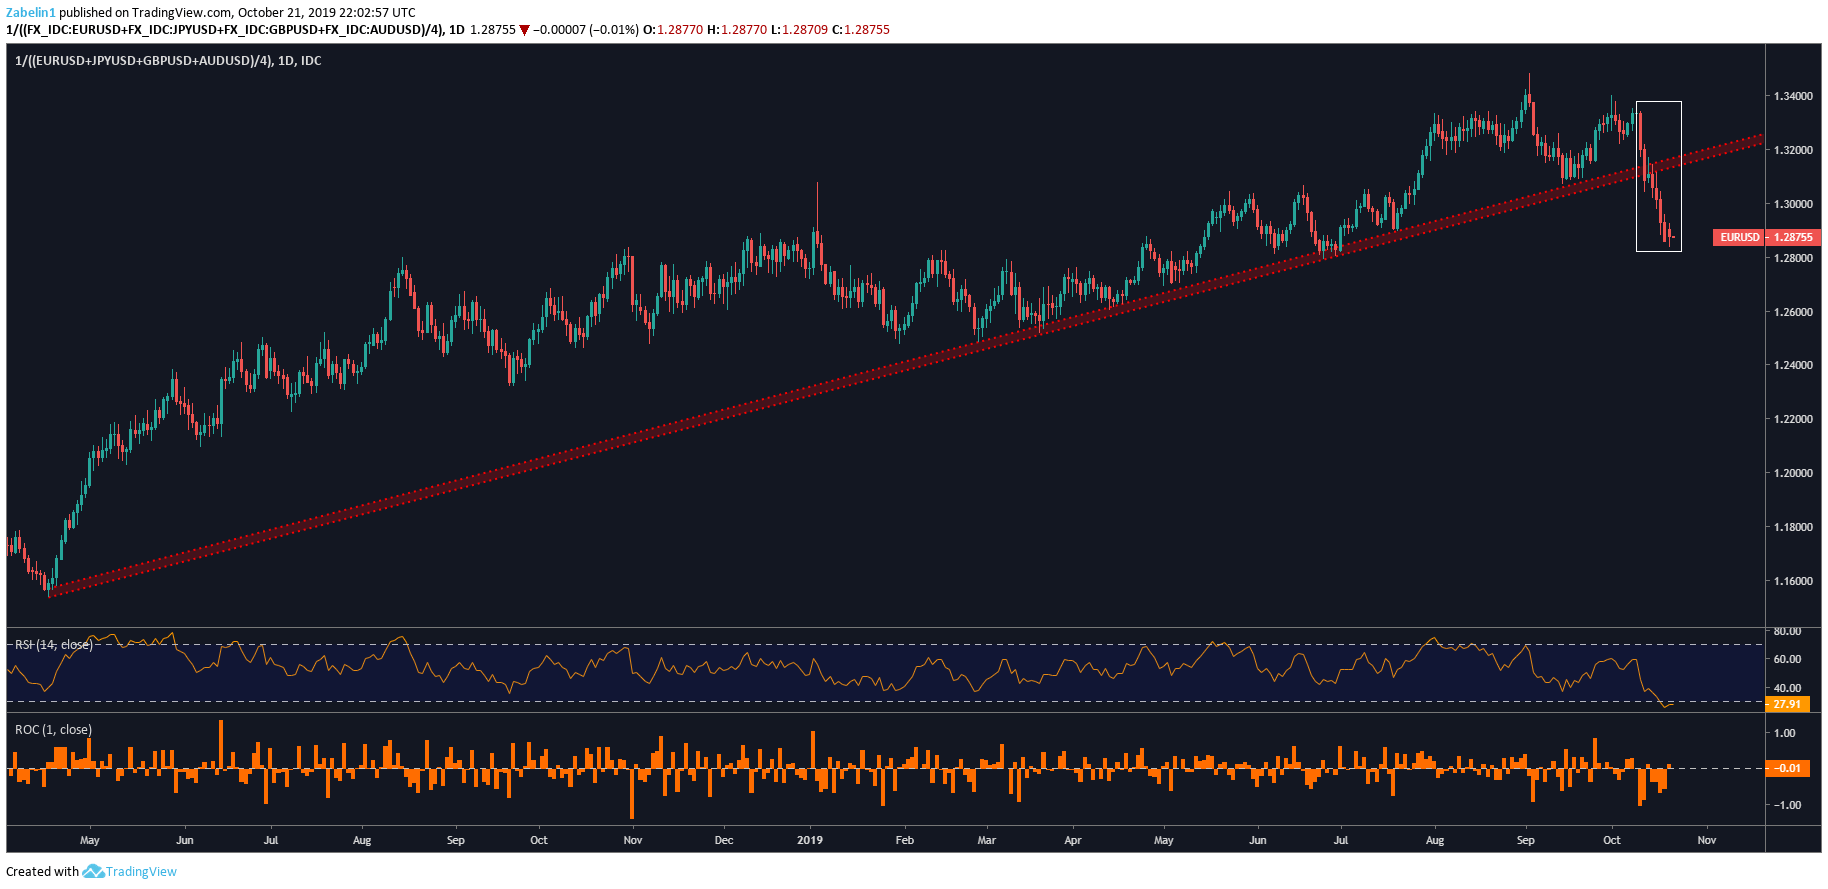
US Dollar chart created using TradingView
Zooming out to a weekly chart shows USD/KRW has also been climbing along an ascending support channel since April 2018. Traders may consider adding to their short positions if the pair breaks below the weekly support level with follow-through. Beyond that, USD/KRW may experience some friction around 1142.
USD/KRW – Weekly Chart
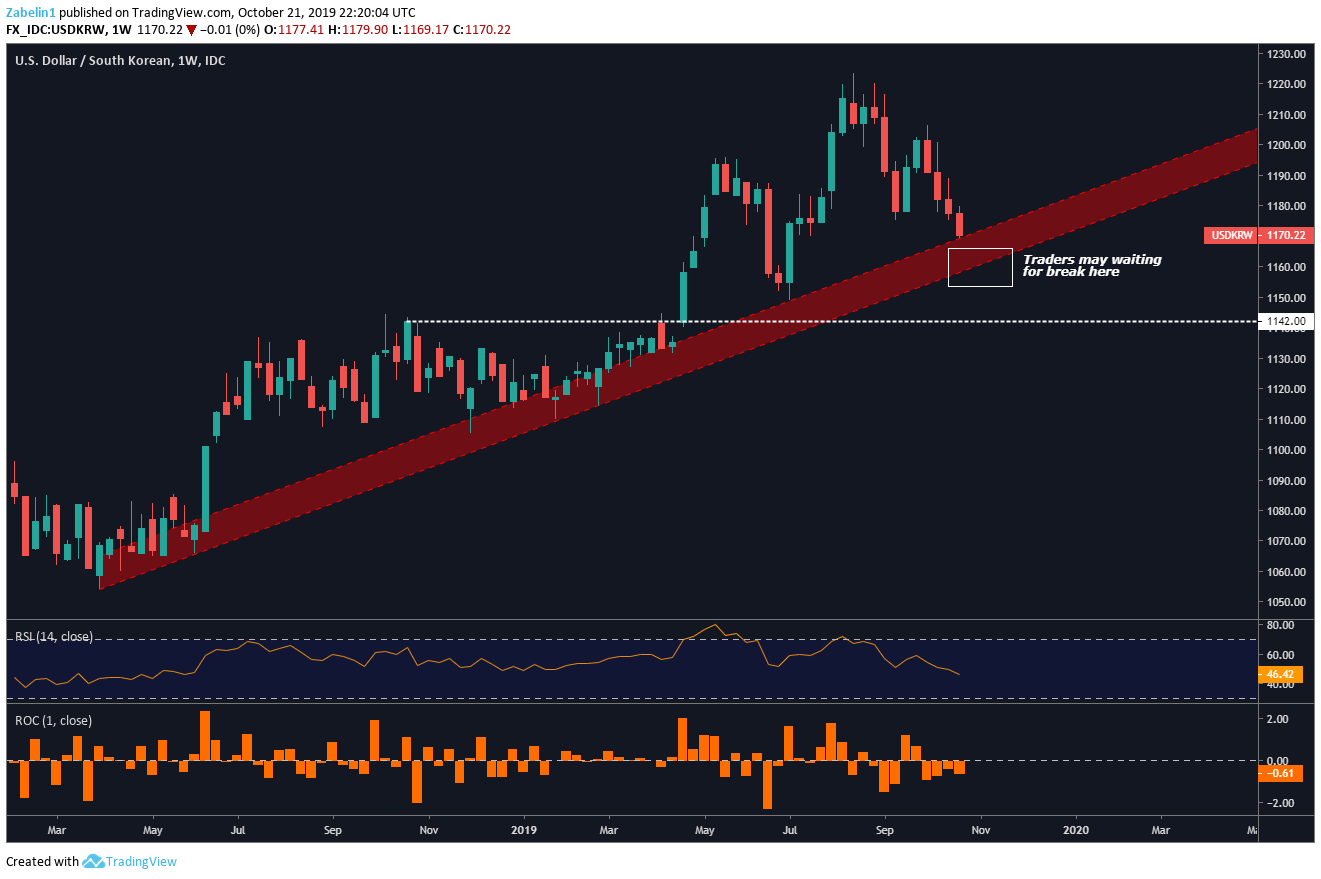
USD/KRW chart created using TradingView
A monthly perspective shows a similar picture to the weekly chart, though it also displays a clearer picture of USD/KRW’s potential downside trajectory. If the pair break below rising support, the monthly chart shows that the next support barrier will be around 1108.0 with a floor below it at 1058.43.
In the short run, traders may look to the daily chart to take advantage of the current downtrend and may then re-evaluate their position if the longer-term time frames support the notion that the pair’s decline is still in play. To get more USD/KRW updates, be sure to follow me on Twitter @ZabelinDimitri.
USD/KRW – Monthly Chart
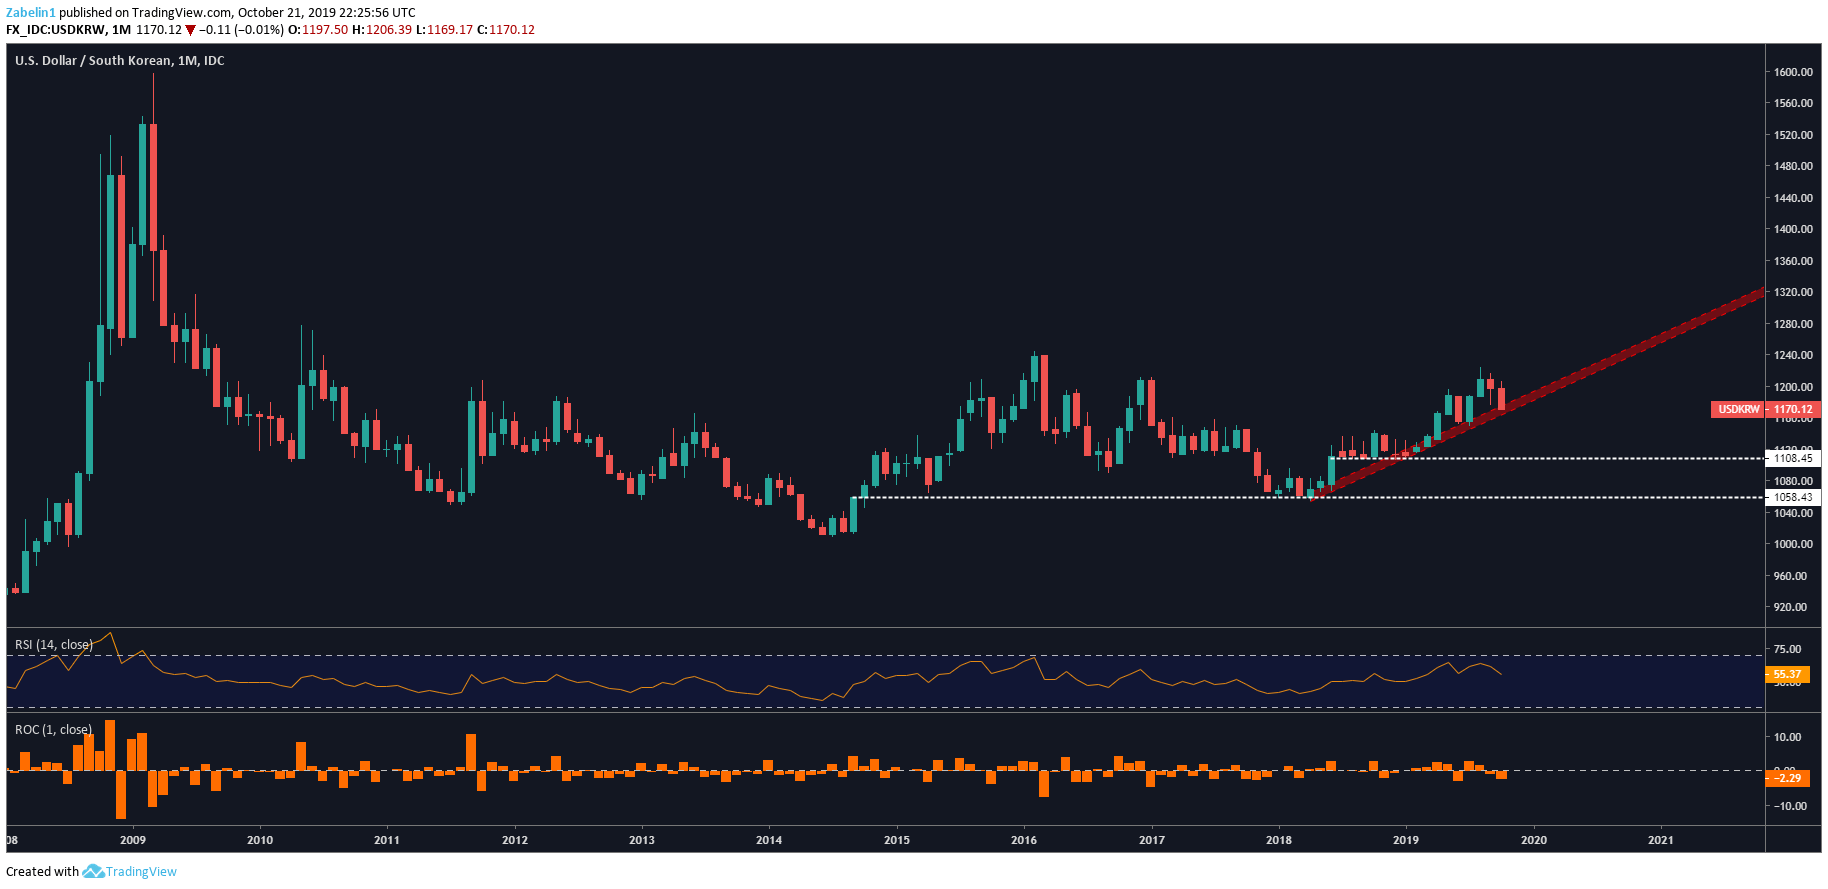
USD/KRW chart created using TradingView
US DOLLAR TRADING RESOURCES
- Join a free webinar and have your trading questions answered
- Just getting started? See our beginners’ guide for FX traders
- Having trouble with your strategy? Here’s the #1 mistake that traders make
--- Written by Dimitri Zabelin, Jr Currency Analyst for DailyFX.com
To contact Dimitri, use the comments section below or @ZabelinDimitri on Twitter


