


Bitcoin Price Technical Forecast
Check out our Q3 USD and Gold forecasts . Download for free main currencies and commodities trading guides.
BTC/USD – Bearish Outlook
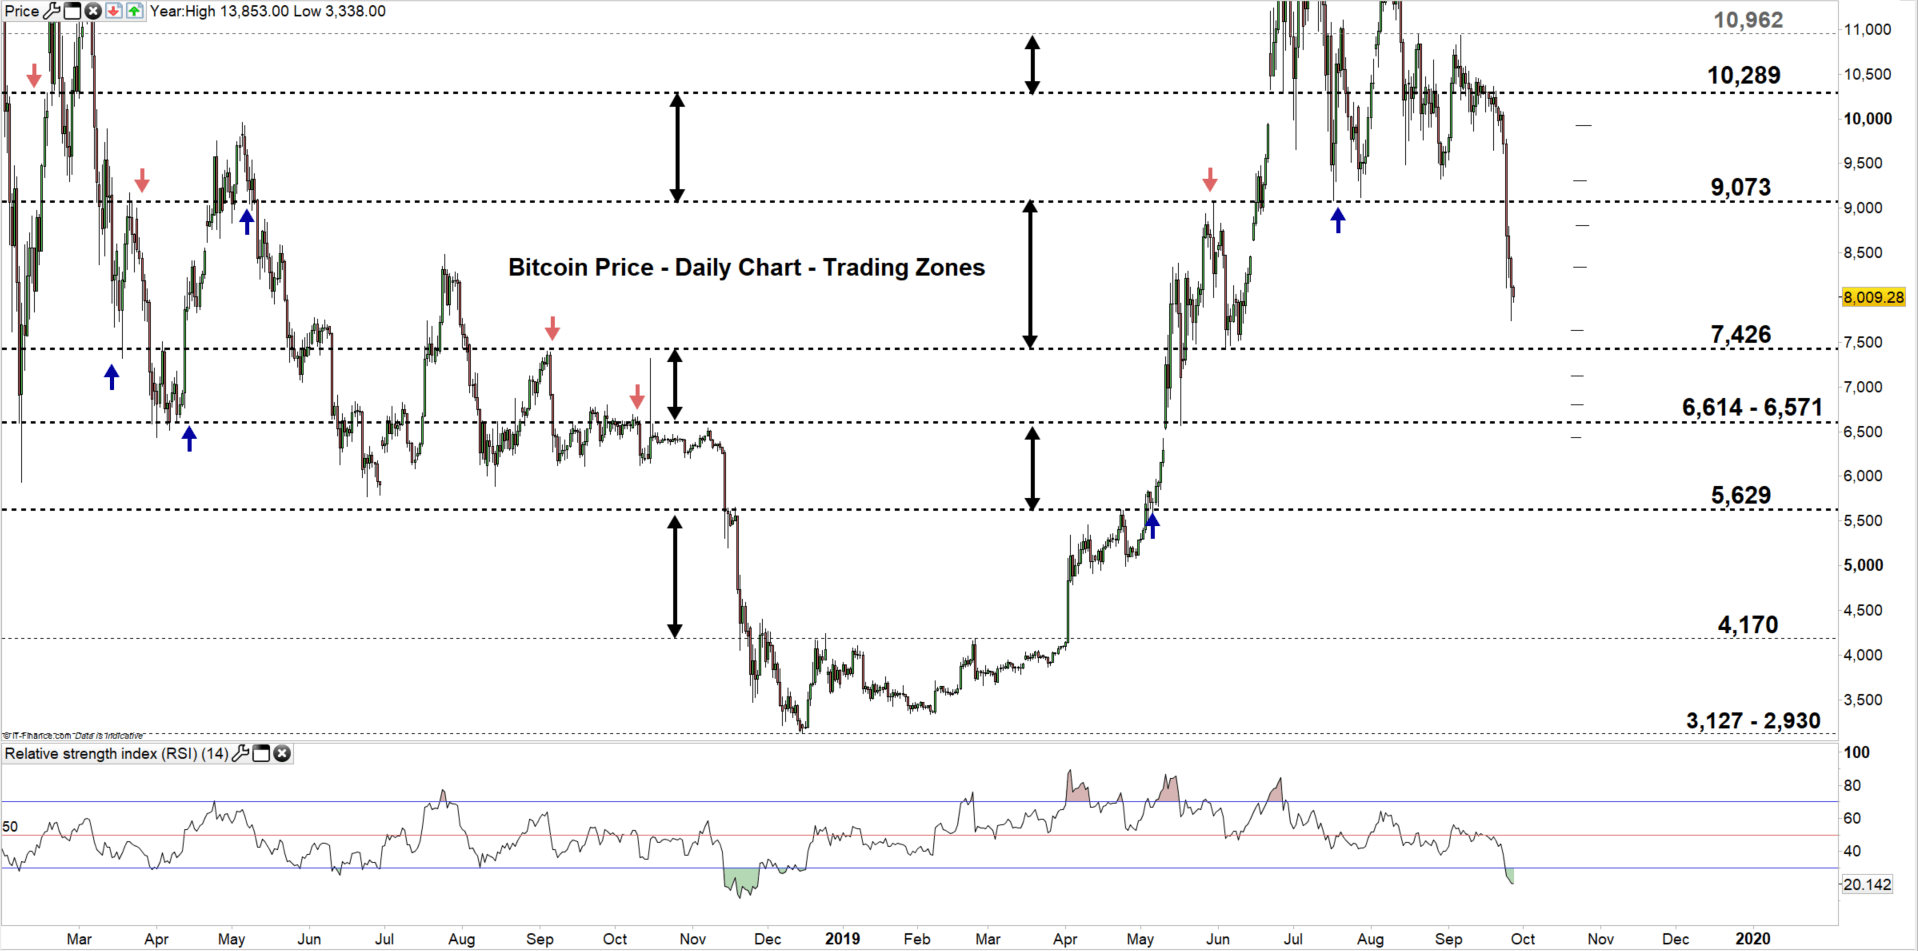
On Sep 6, Bitcoin peaked at 10.940 since then the crypto currency has been trading in a downtrend. On Tuesday, the downtrend accelerated pressing Bitcoin even lower. Yesterday, the BTC/USD printed 7,738 – its lowest level in over three and half months.
The Relative Strength Index (RSI) remained since Tuesday in oversold territory emphasizing the strength of the downtrend momentum.
Just getting started? See our Beginners’ Guide for FX traders
Bitcoin PRICE DAILY CHART (Feb 1, 2018 – Sep 27, 2019) Zoomed Out
Bitcoin PRICE DAILY CHART (May 28 – Sep 27, 2019) Zoomed In
Looking at the daily chart, we notice on Tuesday Bitcoin declined to a lower trading zone 7,426 – 9,073 eyeing a test of the low end of it.
Hence, a close below the low end could cause a price fall towards the vicinity 6,614- 6,571. Further close below 6,571 might see BTC/USD trading even lower towards 5,629. Although, weekly support levels underlined on the chart (zoomed in) should be monitored.
On the other hand, any failure to close below the low end may reserves the price’s direction sending BTC/USD towards the high end of the zone. Further close above the high end could cause a rally towards 10,289. In that scenario the weekly resistance levels underscored on the chart need to be watched closely.
Having trouble with your trading strategy? Here’s the #1 Mistake That Traders Make
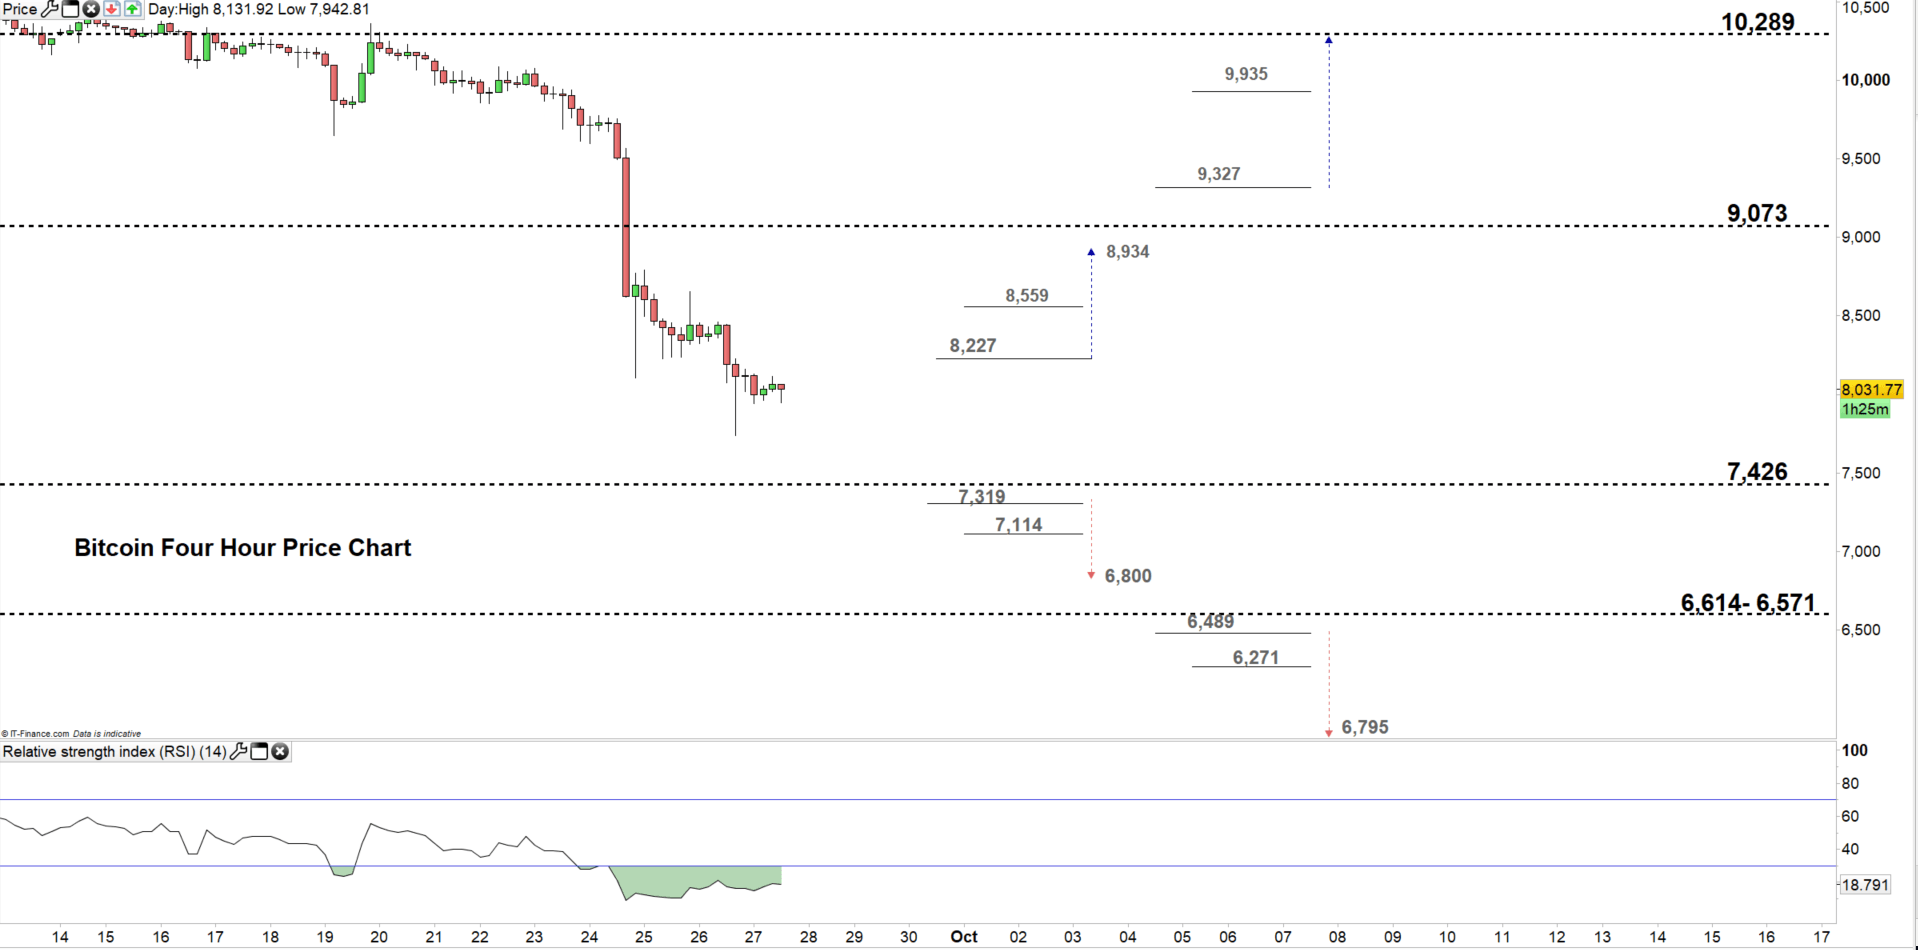
Bitcoin PRICE FOUR Hour CHART (July 28 – Sep 27, 2019)
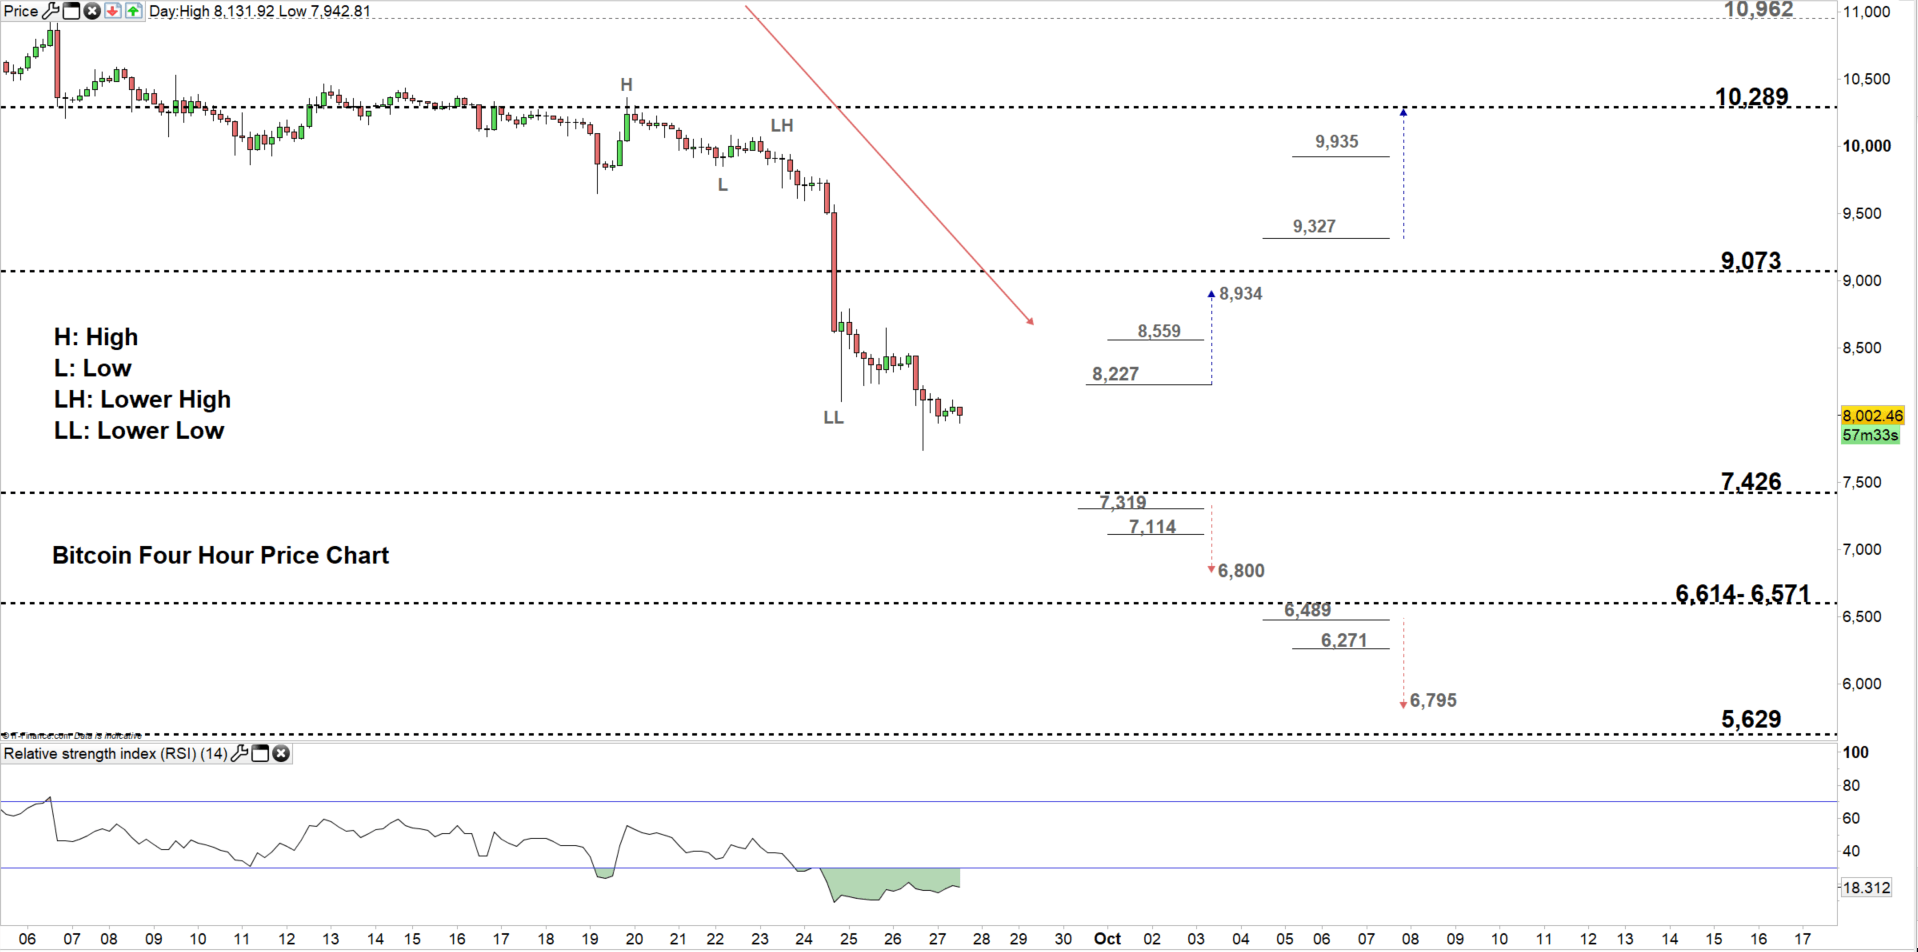
From the four-hour chart, we notice on Sep 19 Bitcoin peaked at 10.363 then resumed bearish price action creating lower highs with lower lows.
Thus, a break below 7,319 could continue bearish price action towards 6,800. Although, the weekly support level marked on the chart would be worth monitoring.
That said, a break above 8,227 could correct the BTC/USD higher towards 8,934. Nevertheless, the weekly resistance level underlined on the chart should be followed closely.
See the chart to know more about the critical levels in a further bearish/ bullish move.
Written By: Mahmoud Alkudsi
Please feel free to contact me on Twitter: @Malkudsi


