


USD/TRY Price Outlook
Check our latest Q3 forecasts for free and learn what is likely to move the markets at this time of the year.
USD/TRY – Stuck in Trendless Move
On Sep 11, USD/TRY corrected lower creating a lower high at 5.7922. In the day after, the pair carved out a higher low at 5.6509 concluding a sideways move.
At the start of this week, the Relative Strength Index (RSI) remained flat nearby 50 indicating to the buyers and sellers lack of momentum to start a clear market trend.
Having trouble with your trading strategy? Here’s the #1 Mistake That Traders Make
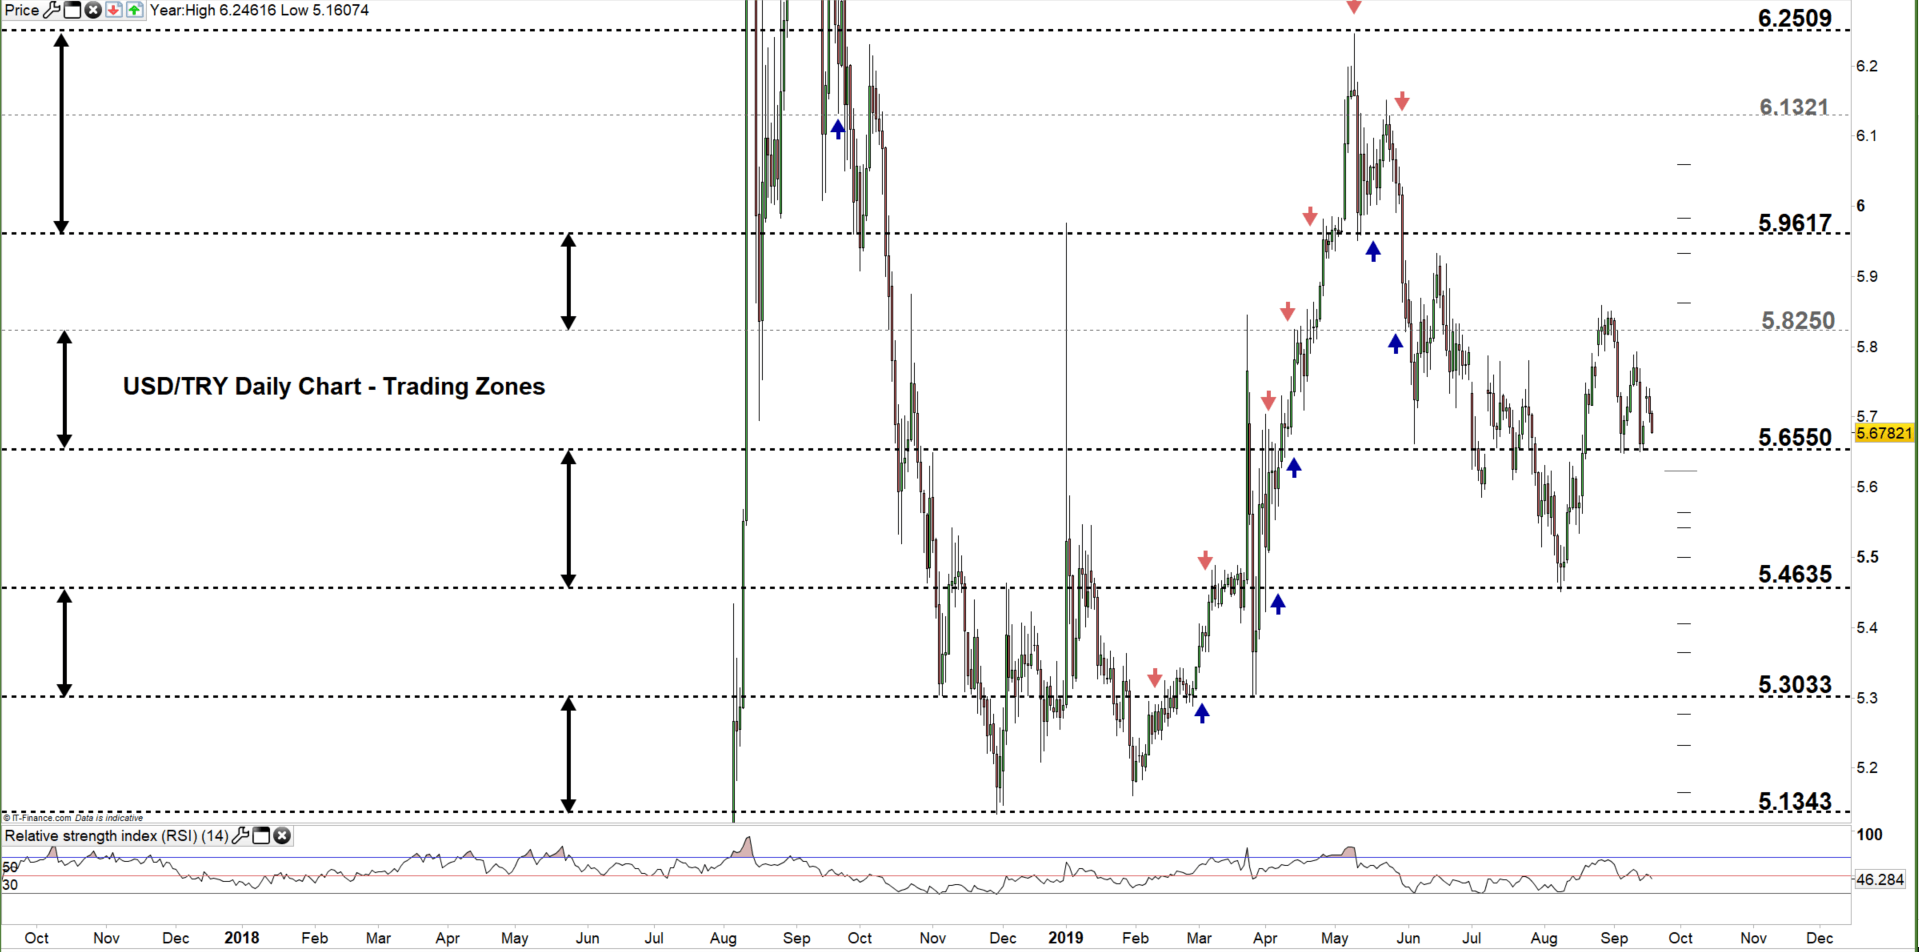
USD/TRY DAILY PRICE CHART (May 28, 2018 – SEp 18, 2019) Zoomed Out
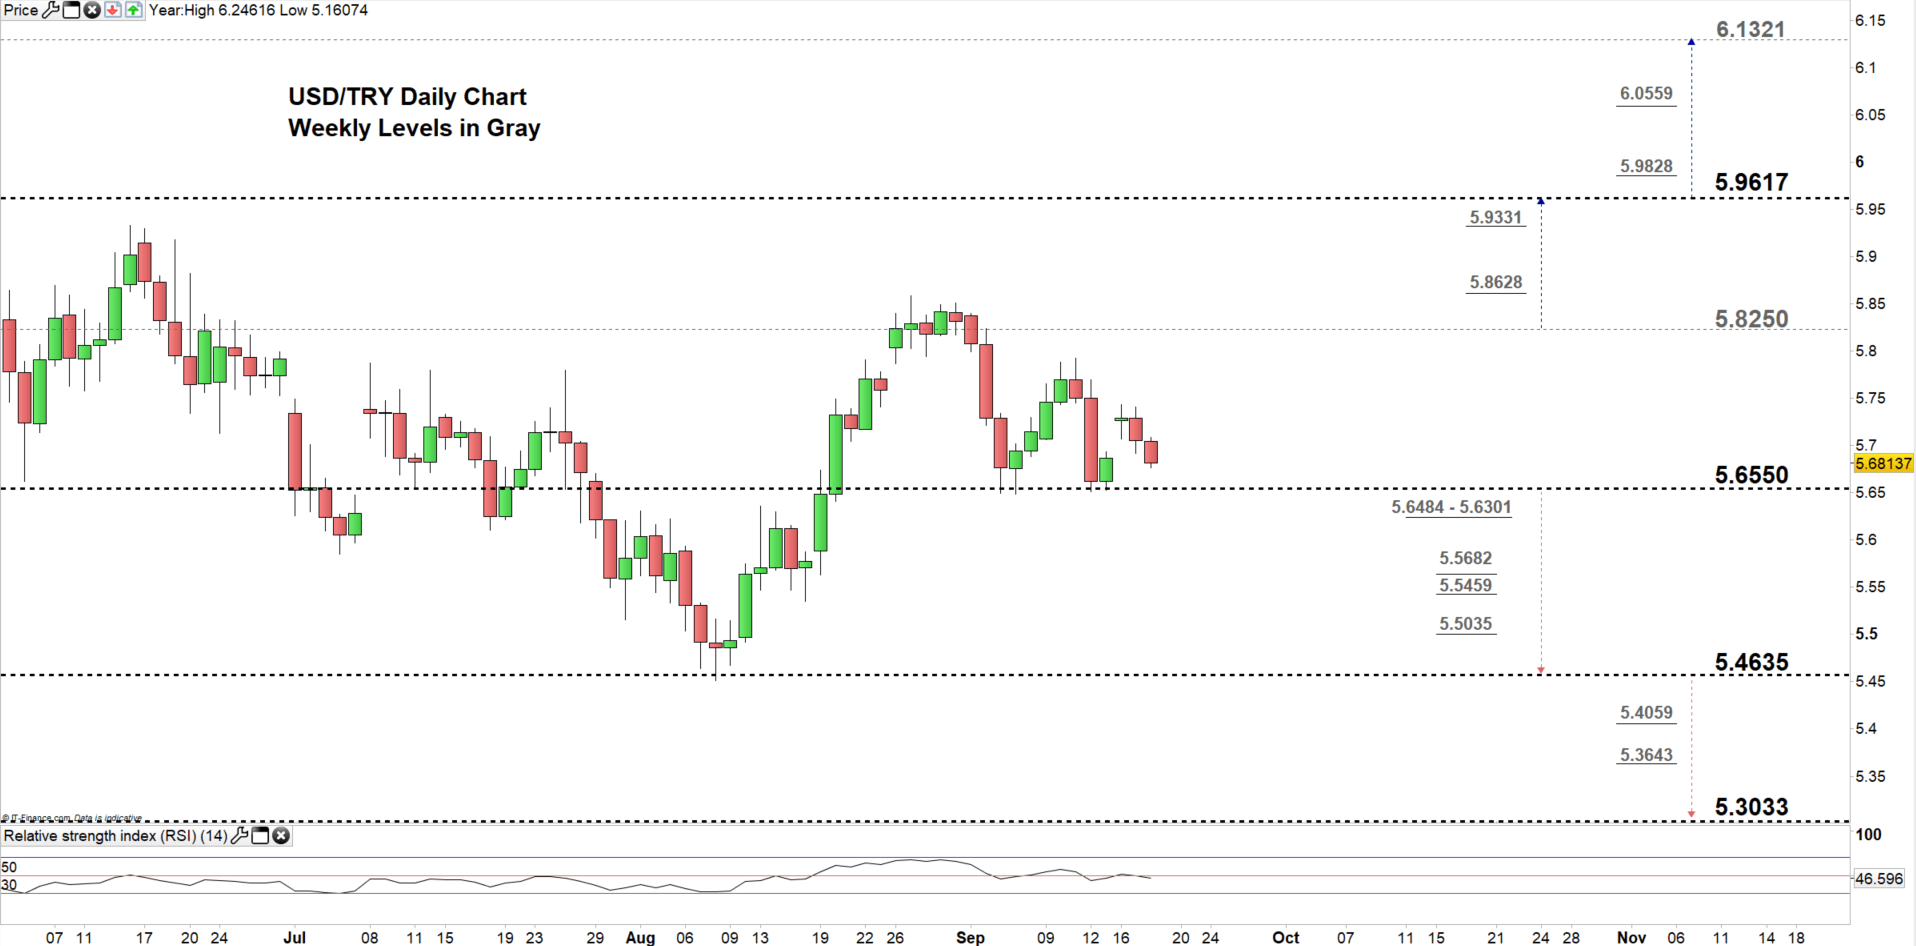
USD/TRY DAILY PRICE CHART (July 5 – Sep 18, 2019) Zoomed In
Looking at the daily chart, we notice since the start of Sep USD/TRY has been trading in the trading zone 5.6550 – 5.8250. Since then, the price rebounded nearby the low end of the zone four times emphasizing the significance of this level (weekly Support).
Hence, any close below the low end could send USDTRY towards 5.4635. Although, the weekly support area and levels marked on the chart (zoomed in) should be kept in focus.
On the flip-side, if sellers keep failing at forcing a close below the low end of the zone, this could push USDTRY towards the high end of it. Further close above the high end may cause a rally towards 5.9617. Nonetheless, the weekly resistance levels underscored on the chart would be worth monitoring.
Just getting started? See our Beginners’ Guide for FX traders
USD/TRY Four-HOUR PRICE CHART (Aug 8, – Sep 18, 2019)

From the four-hour chart, we notice at the start of this week USD/TRY opened with a gap to the upside however, the price found resistance at 5.7430 then slipped back eyeing a test of the low end of the aforementioned trading zone.
It’s worth noting that yesterday USDTRY broke below the second uptrend line on the uptrend Fan. Today, the pair tests the third line on the fan lines eyeing a test of 5.6216. Therefore, a break below this level could see the price trading even lower towards 5.5459. Although, the weekly support level underlined on the chart needs to be considered.
On the other hand, a break above 5.7336 could push USDTRY towards 5.7922. However, the weekly resistance level underscored on the chart should be watched closely. See the chart to know more about support/resistance levels in a further market move.
Written By: Mahmoud Alkudsi
Please feel free to contact me on Twitter: @Malkudsi


