


Brexit Latest Talking Points:
- Concerns about a no-deal, “hard Brexit” continue to swirl amid news that the Queen of England has approved UK Prime Minister Boris Johnson’s request to suspend parliament (what’s known as prorogation).
- With the prorogation starting in early-September, UK parliament will have less than 10 days for debate prior to the October 31 Brexit deadline; it may be the case that UK parliament has to find a solution by September 3 or risk being cut out of the process.
- Retail trader positioning suggests that the current GBPUSD price trend may soon reverse higher despite the fact traders remain net-long.
Looking for longer-term forecasts on the British Pound? Check out the DailyFX Trading Guides.
The Brexit saga took a new turn that has market participants concerned about a no-deal, “hard Brexit.” Amid news that the Queen of England has approved UK Prime Minister Boris Johnson’s request to suspend parliament (what’s known as “prorogation”), speculation has arisen that the limited window for UK parliament to debate the Brexit process increases the likelihood that a no-deal, “hard Brexit” will transpire come October 31, 2019.
What’s Next in the Brexit Process?
While the market reaction to UK PM Johnson’s has been contained, the political reaction has not. UK MPs have been quick to condemn the move as an effort to sidestep parliamentary inclusion in the Brexit process. But prorogation isn’t unusual, as it typically occurs in the run-up to a new session marked by a Queen’s speech (which will take place on October 17). Indeed, there was a recess looking to be scheduled through October 7 as is.
But because the new calendar means that UK parliament will have less than 10 days to debate Brexit prior to the October 31 deadline, there is now increased pressure to find a solution prior to recess beginning. In effect, UK parliament has until September 3 to have a meaningful say in the Brexit process.
If the market reaction has been limited today for the British Pound, it may be due to the fact that the Queen’s speech on October 17 will effectively be a no-confidence vote for UK PM Johnson.
By proroguing parliament (as is his right to do prior to a new parliamentary session), the UK prime minister may have inadvertently calcified support against him for a new general election – which in turn would mean that Brexit would have to be delayed, perhaps why the British Pound hasn’t suffered more than the headlines would appear to suggest.
GBPUSD TECHNICAL ANALYSIS: WEEKLY TIMEFRAME (JUNE 2016 TO AUGUST 2019) (CHART 1)
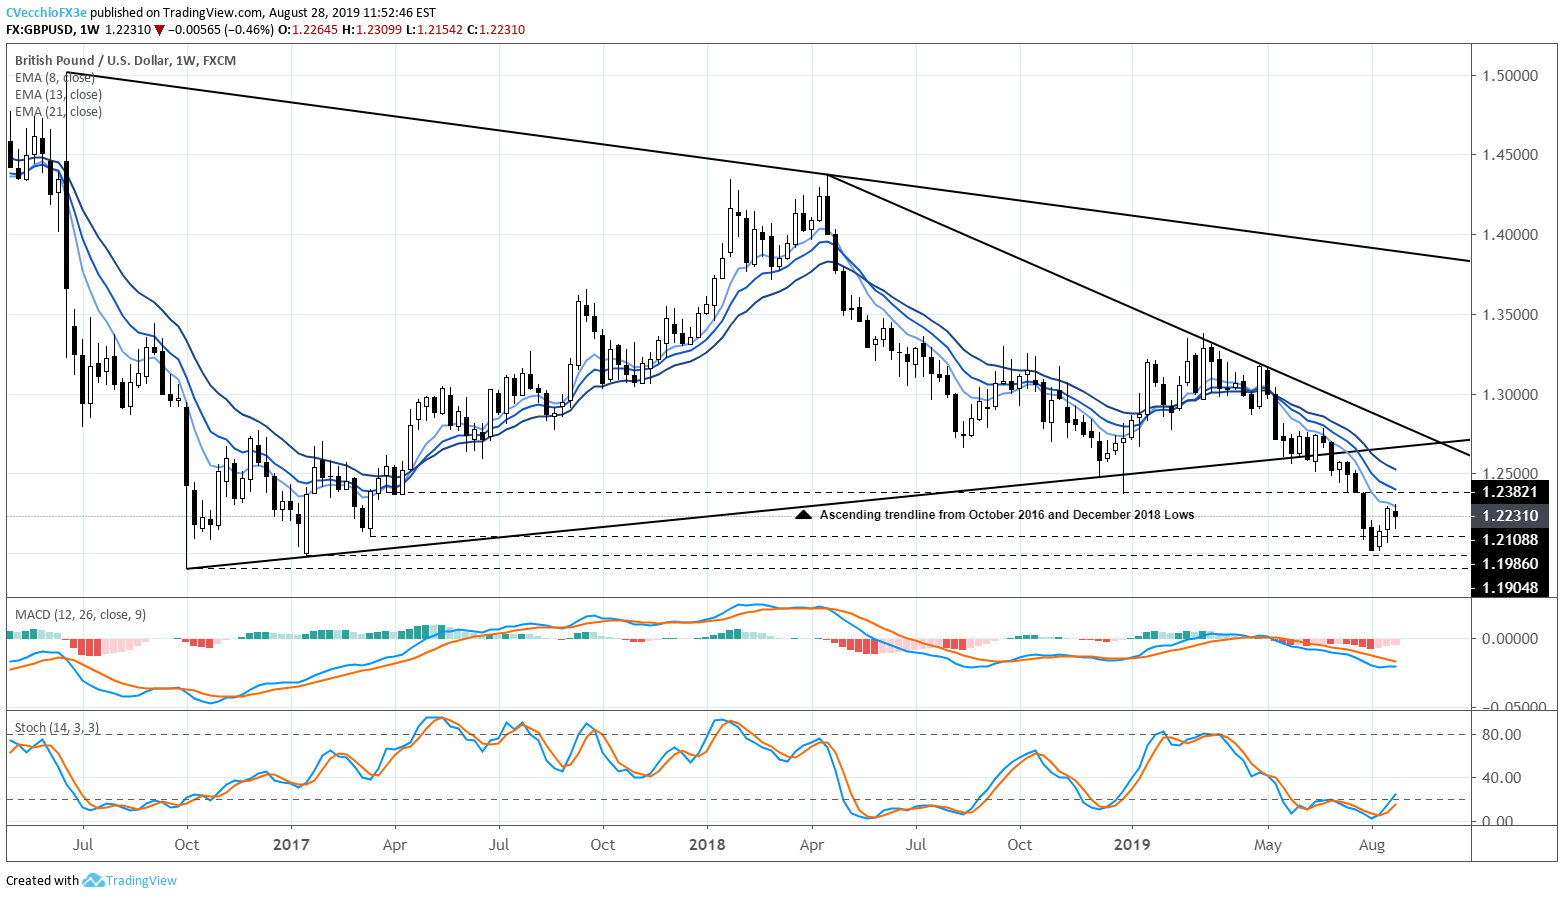
The weekly timeframe continues to showcase the damage that Brexit has inflicted upon GBPUSD rates. A gap open higher last week has been met by an inside bar this week, with prices failing to retake the weekly 8-EMA; GBPUSD prices have remained below the weekly 8- and 13-EMAs since the first week of May. Overall, the January 2017 low is in focus at 1.1986, with the post-Brexit vote in October 2016 coming into focus shortly thereafter at 1.1905. Only a break above the weekly 8-EMA as well as the descending trendline from the May and June 2019 highs would constitute a reason to suspect higher GBPUSD prices in the future.
GBPUSD Technical Analysis: Daily Price Chart (August 2018 to August 2019) (Chart 2)

In our last GBPUSD technical forecast update, it was noted that “a close above the daily 21-EMA (1.2195) would increase the likelihood of a further rebound in GBPUSD prices back to the descending trendline from the May and June highs closer towards 1.2380/85 over the coming sessions.”
Daily MACD continues to push higher (albeit in bearish territory), while Slow Stochastics are holding in overbought territory. Now that GBPUSD prices have started to spend more time above the daily 8-, 13-, and 21-EMA envelope, the scope for further gains in the short-term has increased.
IG Client Sentiment Index: GBPUSD Price Forecast (August 28, 2019) (Chart 3)

GBPUSD: Retail trader data shows 66.4% of traders are net-long with the ratio of traders long to short at 1.98 to 1. In fact, traders have remained net-long since May 6 when GBPUSD traded near 1.2987; price has moved 5.8% lower since then. The number of traders net-long is 4.2% lower than yesterday and 10.6% lower from last week, while the number of traders net-short is 15.0% higher than yesterday and 24.9% higher from last week.
We typically take a contrarian view to crowd sentiment, and the fact traders are net-long suggests GBPUSD prices may continue to fall. Yet traders are less net-long than yesterday and compared with last week. Recent changes in sentiment warn that the current GBPUSD price trend may soon reverse higher despite the fact traders remain net-long.
GBPJPY Technical Analysis: Daily Price Chart (October 2016 to August 2019) (Chart 4)
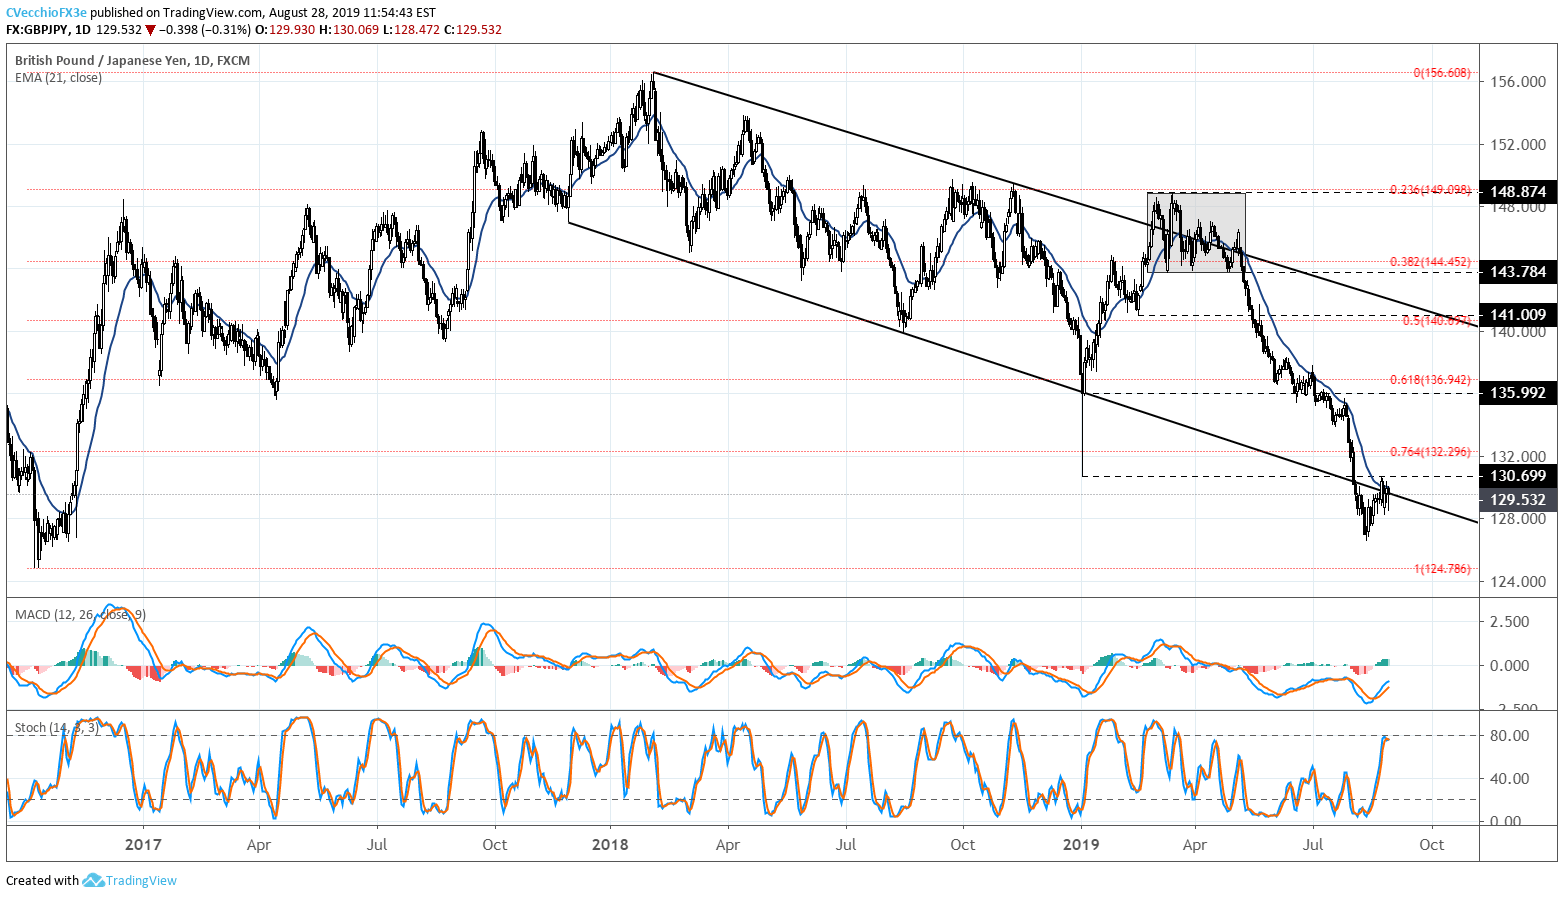
GBPJPY losses continue to consolidate after breaking down through channel support on the way to fresh yearly lows. Last week it was noted that “a return to the former channel support and daily 21-EMA can’t be ruled out in the near-term (129.90/130.32).” We continue to hold around these levels.
GBPJPY Technical Analysis: Daily Price Chart (August 2018 to August 2019) (Chart 5)

In our last GBPJPY technical forecast update it was noted that “while gains have been consistent in recent days, there is still not enough technical evidence to suggest that a bottom is in place. Selling rallies remains the preferred outcome for the time being.” A break above the former 2019 low (set around the Yen flash crash in January 2019) would suggest a more bottoming effort is coming into shape. A move above 130.70 would suggest the low has been set.
IG Client Sentiment Index: GBPJPY Price Forecast (August 28, 2019) (Chart 6)

GBPJPY: Retail trader data shows 69.0% of traders are net-long with the ratio of traders long to short at 2.23 to 1. In fact, traders have remained net-long since May 6 when GBPJPY traded near 145.42; price has moved 10.9% lower since then. The number of traders net-long is 2.0% lower than yesterday and 13.1% lower from last week, while the number of traders net-short is 12.7% higher than yesterday and 8.4% lower from last week.
We typically take a contrarian view to crowd sentiment, and the fact traders are net-long suggests GBPJPY prices may continue to fall. Yet traders are less net-long than yesterday and compared with last week. Recent changes in sentiment warn that the current GBPJPY price trend may soon reverse higher despite the fact traders remain net-long.
EURGBP Technical Analysis: Monthly Price Chart (1998 to 2019) (Chart 7)

The EURGBP monthly timeframe is instructive given recent price action. As EURGBP challenged the 2017 yearly high, there was an attempt to breakout of a sideways channel going back to early-2017 between 0.8472 and 0.9307.
While this has not gained traction thus far, there may be a more significant bullish breakout taking shape: the symmetrical triangle that has defined nearly the entirety of EURGBP’s trading history, going back to the lows in 2000 and the highs in 2008.
EURGBP Technical Analysis: Daily Price Chart (August 2018 to August 2019) (Chart 8)

In our last EURGBP technical forecast update, it was noted that “[bullish] momentum has waned in recent days, with EURGBP prices now below the daily 8-, 13-, and 21-EMA envelope; daily MACD has turned lower, albeit in bullish territory; and Slow Stochastics has slumped into oversold territory. Remarkably, EURGBP has sustained elevated levels despite the bearish turn in momentum; the uptrend from the May and July 2019 lows has been sustained. Until this breaks, traders should be on alert for the longer-term upside breakout potential.”
This view remains valid as price has not evolved in a meaningful way in recent days. Both daily MACD and Slow Stochastics continue to trend lower. EURGBP prices have moved sideways, and given that trading is both a function of price and time, EURGBP now finds itself below the rising trendline from the May and July 2019 swing lows. A drop below the descending trendline from the 2008 and 2016 highs would suggest a deeper pullback.
IG Client Sentiment Index: EURGBP Price Forecast (August 28, 2019) (Chart 9)

EURGBP: Retail trader data shows 29.7% of traders are net-long with the ratio of traders short to long at 2.36 to 1. In fact, traders have remained net-short since May 9 when EURGBP traded near 0.8673; price has moved 4.4% higher since then. The number of traders net-long is 6.9% higher than yesterday and 8.9% higher from last week, while the number of traders net-short is 14.2% lower than yesterday and 12.4% lower from last week.
We typically take a contrarian view to crowd sentiment, and the fact traders are net-short suggests EURGBP prices may continue to rise. Yet traders are less net-short than yesterday and compared with last week. Recent changes in sentiment warn that the current EURGBP price trend may soon reverse lower despite the fact traders remain net-short.
What Happens to the British Pound: No Deal, Hard Brexit
Under a no-deal, hard Brexit outcome, traders should expect further losses by the British Pound, with EUR/GBP likely to trade closer to parity (1.0000), GBP/JPY could trade towards 120.00, while GBP/USD could fall towards 1.1000 during the first 12-months of a no-deal, hard Brexit (keeping in mind that the European Central Bank and Federal Reserve would likely cut interest rates to prevent Brexit shocks from impacting either the Eurozone or US economies too significantly, thereby capping potential gains by the Euro and the US Dollar versus the British Pound).
What Happens to the British Pound: No Deal, Hard Brexit + Scottish Exit
But this would not be the worst case scenario for the British Pound; in the event that Scotland holds a second independence referendum, it’s likely markets will be facing down the threat of disintegration of Great Britain as we know it. Under a no-deal, hard Brexit coupled with a Scottish vote to leave the UK, traders should expect EUR/GBP to climb towards 1.0500, GBP/JPY to fall towards 112.50, and GBP/USD to drop closer to 1.0500.
What Happens to the British Pound: Second Referendum
The only hope that the British Pound has for a significant recover is if Brexit is avoided altogether: after all, it will be impossible to replace the economic activity lost endured from leaving the EU, the world’s largest single market. In the event that the next UK prime minister has a change of heart and takes steps to avoid Brexit (e.g. a second referendum or withdrawing Article 50), EUR/GBP could fall back towards £0.8000, GBP/JPY could rally back towards 150.00, and GBP/USD could climb back towards $1.4000; a full-scale recovery back to pre-June 2016 Brexit vote levels is highly unlikely in the immediate aftermath of the cancellation of Brexit.
FX TRADING RESOURCES
Whether you are a new or experienced trader, DailyFX has multiple resources available to help you: an indicator for monitoring trader sentiment; quarterly trading forecasts; analytical and educational webinars held daily; trading guides to help you improve trading performance, and even one for those who are new to FX trading.
--- Written by Christopher Vecchio, CFA, Senior Currency Strategist
To contact Christopher Vecchio, e-mail at cvecchio@dailyfx.com
Follow him on Twitter at @CVecchioFX
View our long-term forecasts with the DailyFX Trading Guides


