


Bitcoin Price Outlook
Check out our Q3 USD and Gold forecasts . Download for free main currencies and commodities trading guides.
BTC/USD Price – Sideways Move
On Tuesday, Bitcoin corrected lower creating a lower high at 10,950. Since then the cryptocurrency has been moving without a clear direction.
Since August 13, the Relative Strength Index (RSI) remained flat crossing above and below 50 indicating to the lack of momentum for an upward nor a downward move.
Just getting started? See our Beginners’ Guide for FX traders
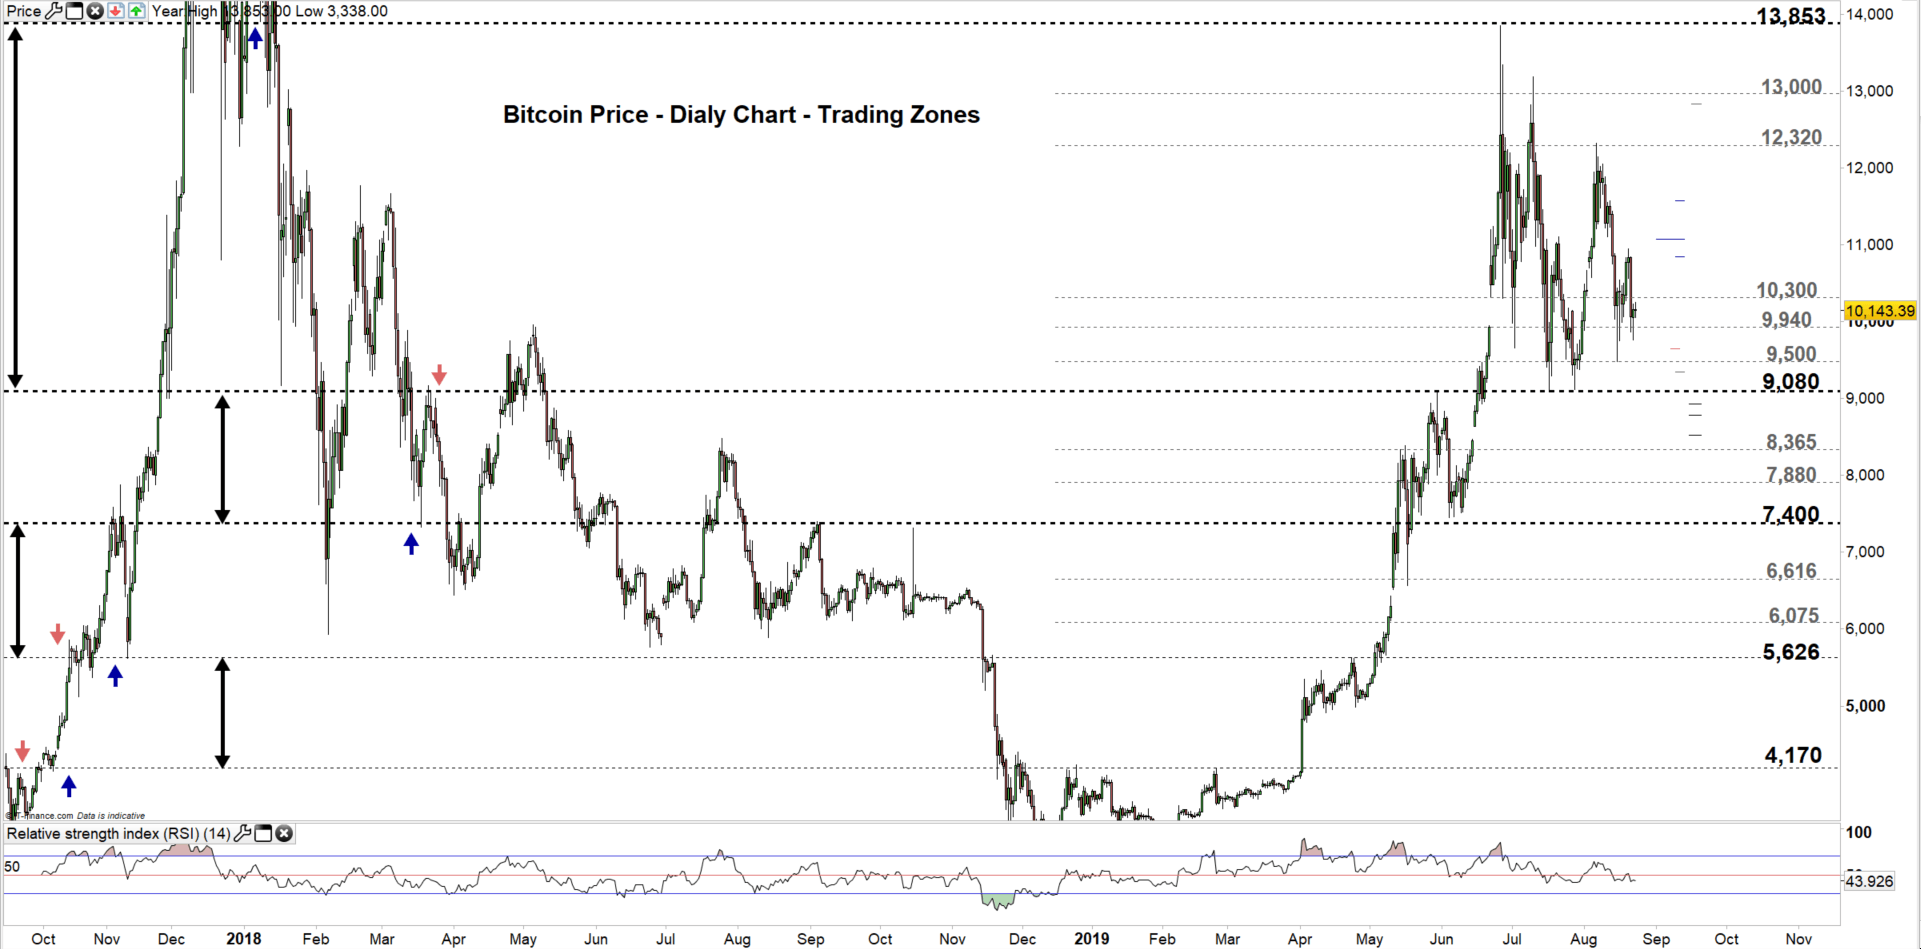
Bitcoin PRICE DAILY CHART (Oct 1– AUG 16, 2019) Zoomed Out
Bitcoin PRICE DAILY CHART (May 28 – AUG 16, 2019) Zoomed In
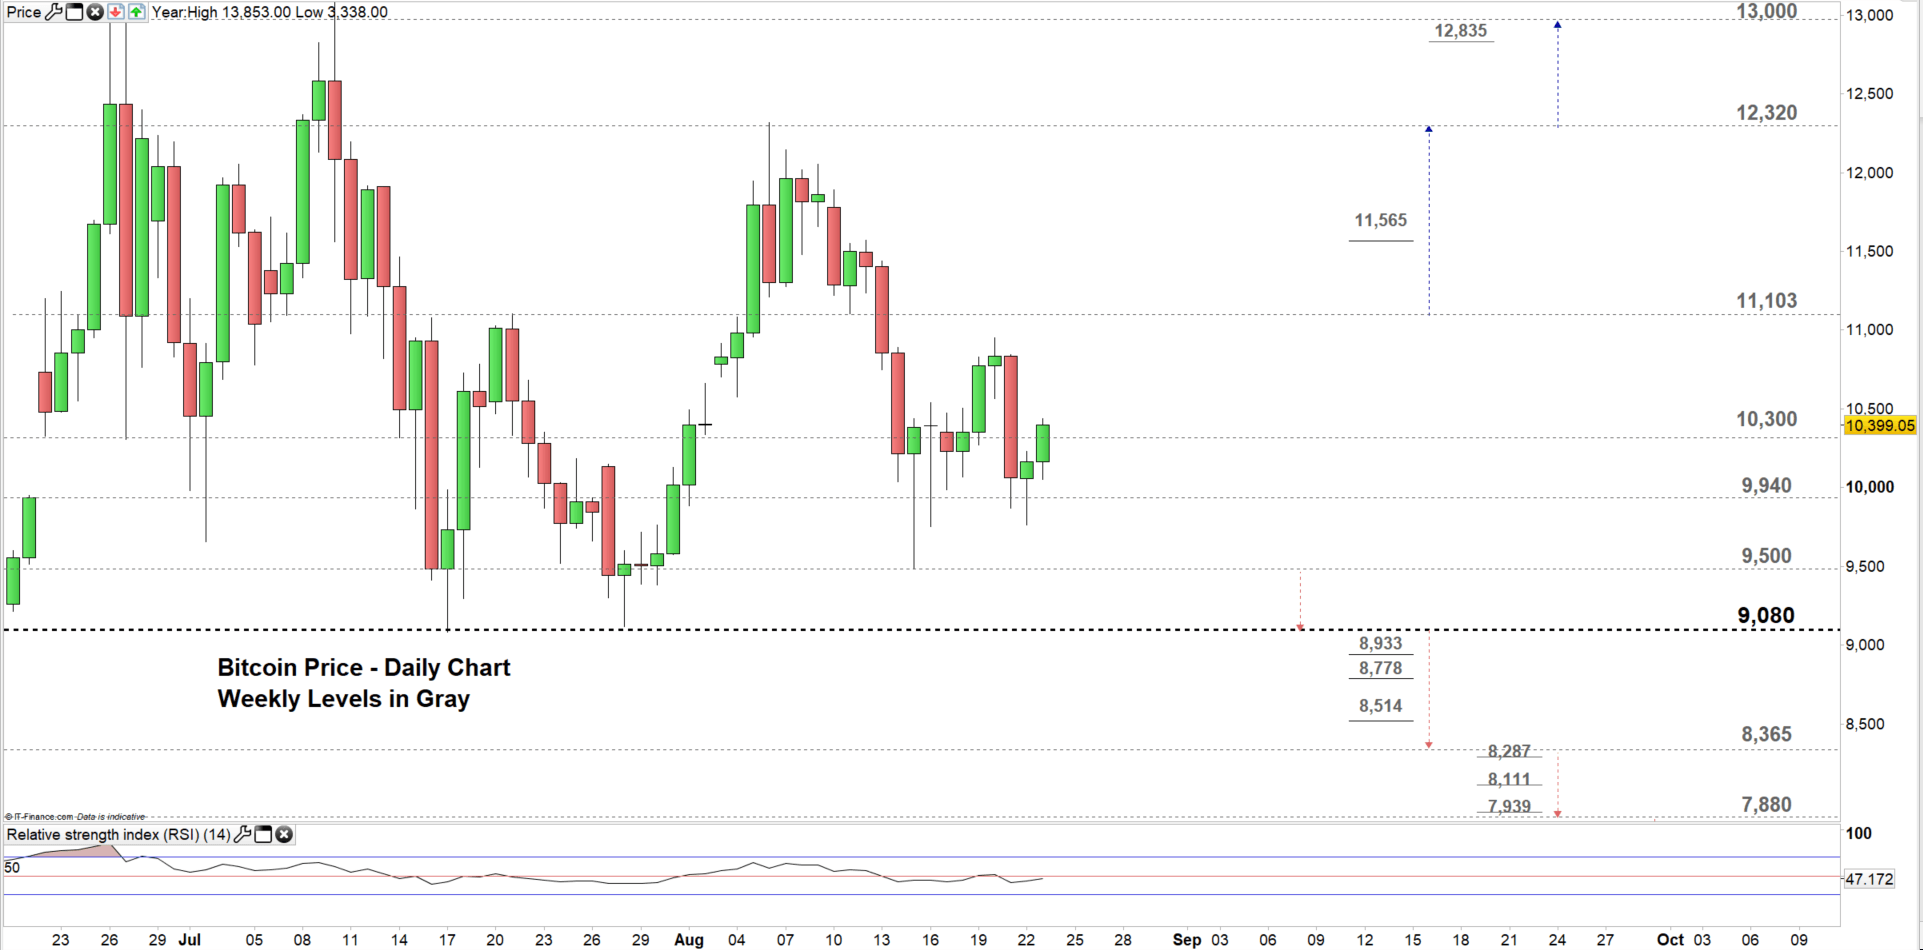
Looking at the daily chart, we notice today Bitcoin testing a higher trading zone 10,300 – 11,103. Hence, a close above the high end of the zone could push the price to the high end. Further close above the high end may cause a rally towards 12,320. Nonetheless, the weekly resistance level marked on the chart (zoomed in) would be worth monitoring.
In turn, any failure in closing above the low end could send the price towards 9,940. Further close below this level could press the price even lower towards 9,500. Check the chart to know more about the lower trading zone/s with the support level BTC/USD sellers would need to watch closely.
Having trouble with your trading strategy? Here’s the #1 Mistake That Traders Make
Bitcoin PRICE FOUR Hour CHART (July 28 – AUg 16, 2019)
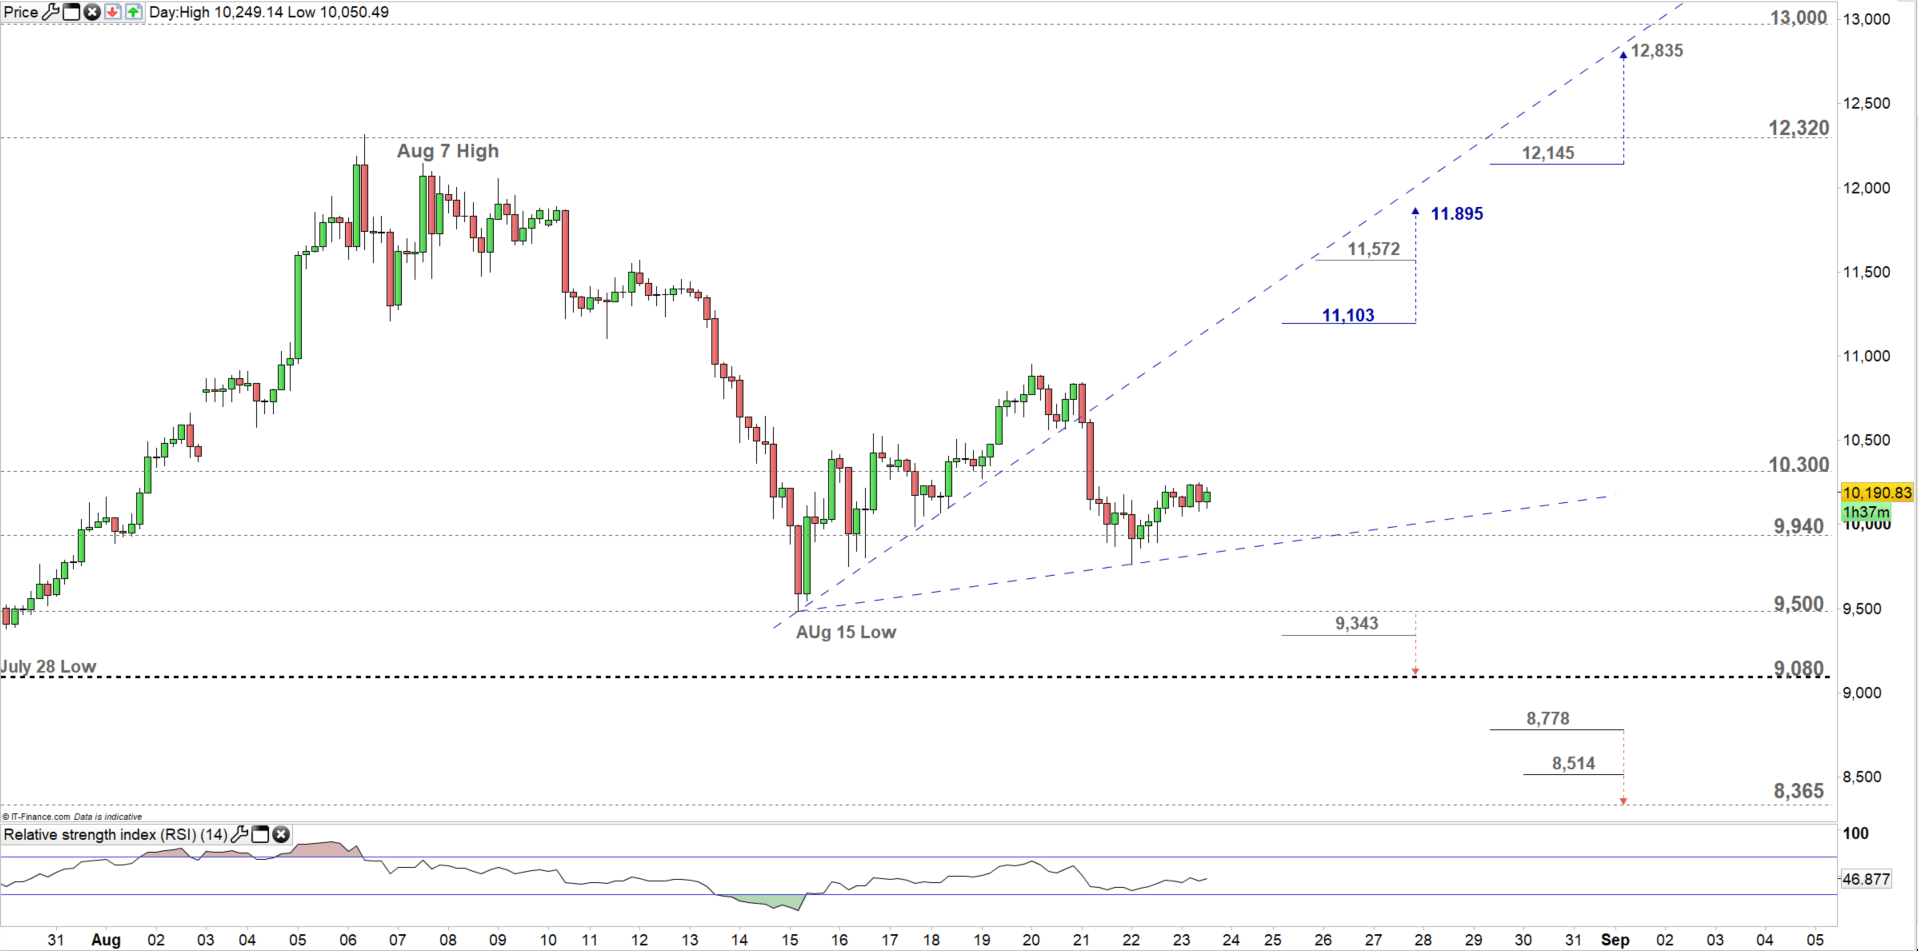
Looking at the four-hour chart, we notice on August 15 Bitcoin started an uptrend move creating higher highs with higher lows. On August 21, BTC/USD corrected lower carving out a lower low at 9,761.
Thus, a break below the August 15 low at 9,484 could send the price towards 9,080. However, the weekly support level underlined on the chart needs to be monitored. See the chart to know more about the lower support level Bitcoin price would encounter in a further bearish scenario.
On the flip-side, if BTC/USD overtakes the uptrend line originated from the aforementioned August 15 low, then breaks above 11,103 this suggests the cryptocurrency may rally towards 11,895. Although, the weekly resistance level underscored on the chart needs to be considered. See the chart to find out more about the higher resistance level Bitcoin price would face in a further bullish scenario.
Written By: Mahmoud Alkudsi
Please feel free to contact me on Twitter: @Malkudsi


