


USD/TRY Price Outlook
Check our latest Q3 forecasts for free and learn what is likely to move the markets at this time of the year.
USD/TRY – Trading Higher
On August 8, USD/TRY reversed direction then started uptrend momentum creating a higher high at 5.6356 with a higher low at 5.5347. Consequently, the pair tested yesterday its highest level in four weeks at 5.7488.
This week, the Relative Strength Index (RSI) crossed above 50 and climbed to 61 for the first time in over two months, reflecting buyer’s domination at this stage.
Having trouble with your trading strategy? Here’s the #1 Mistake That Traders Make
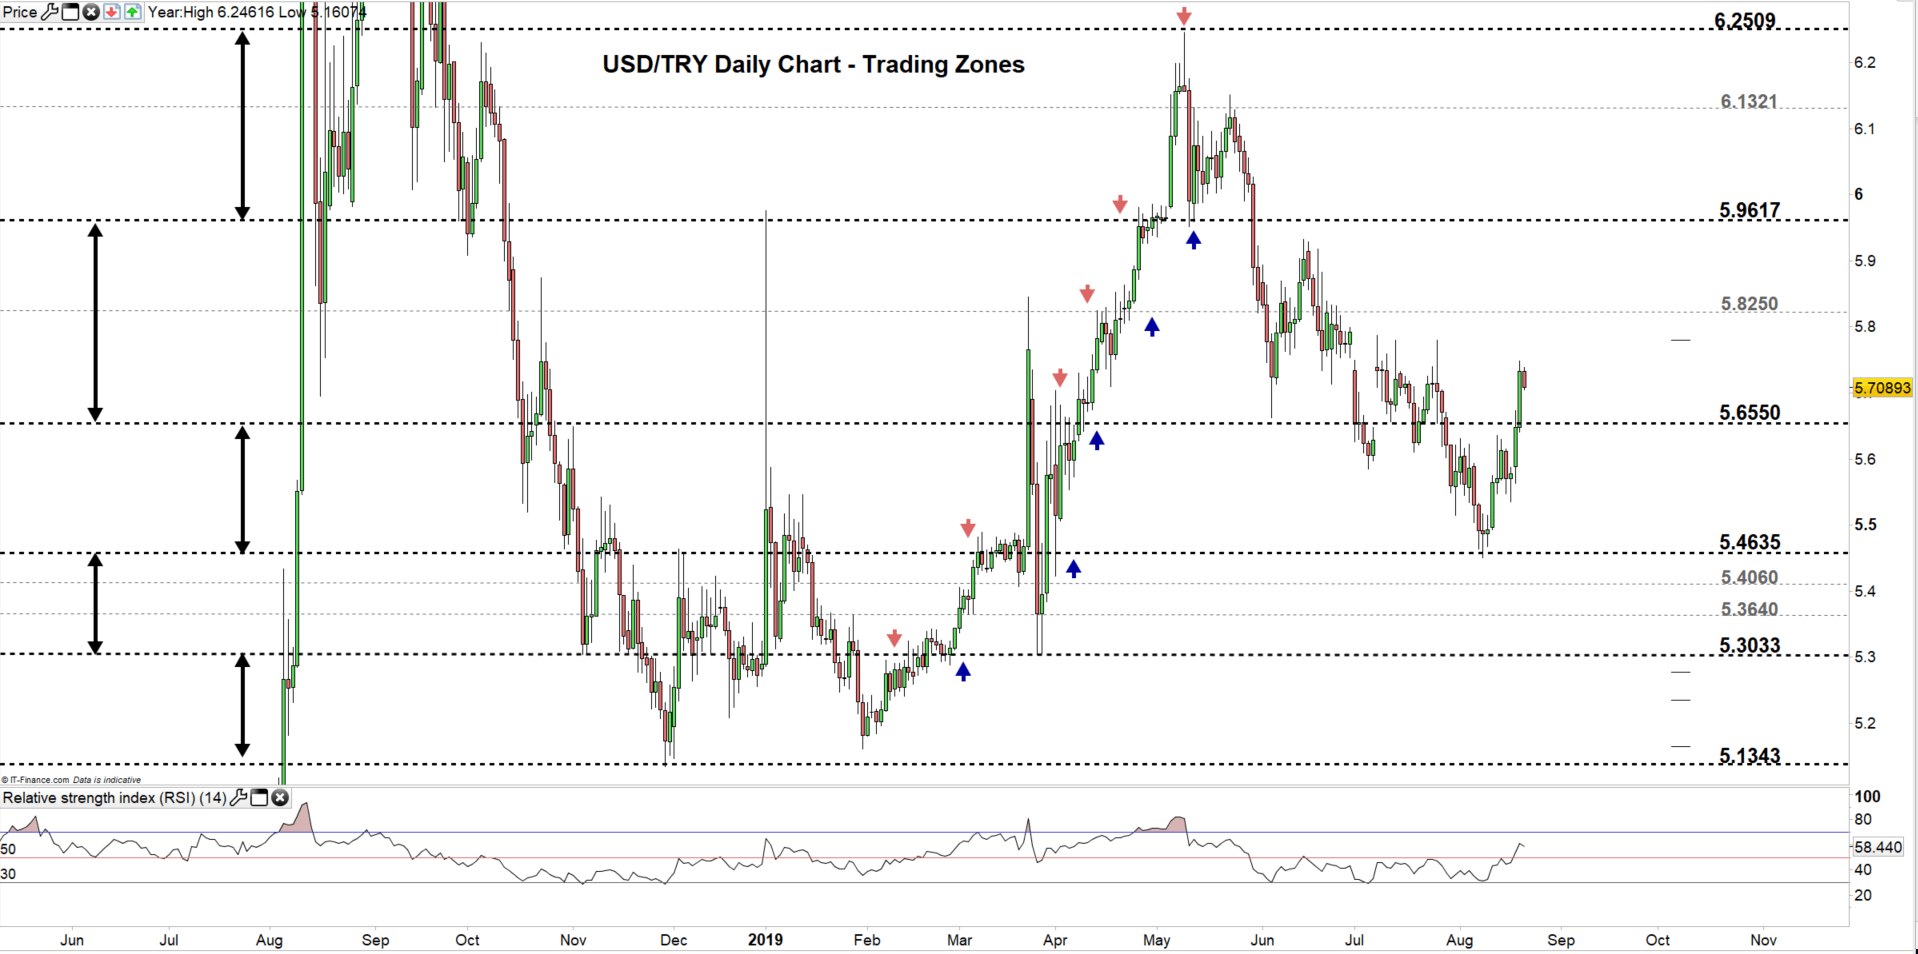
USD/TRY DAILY PRICE CHART (May 3, 2018 – AUG 21, 2019) Zoomed Out
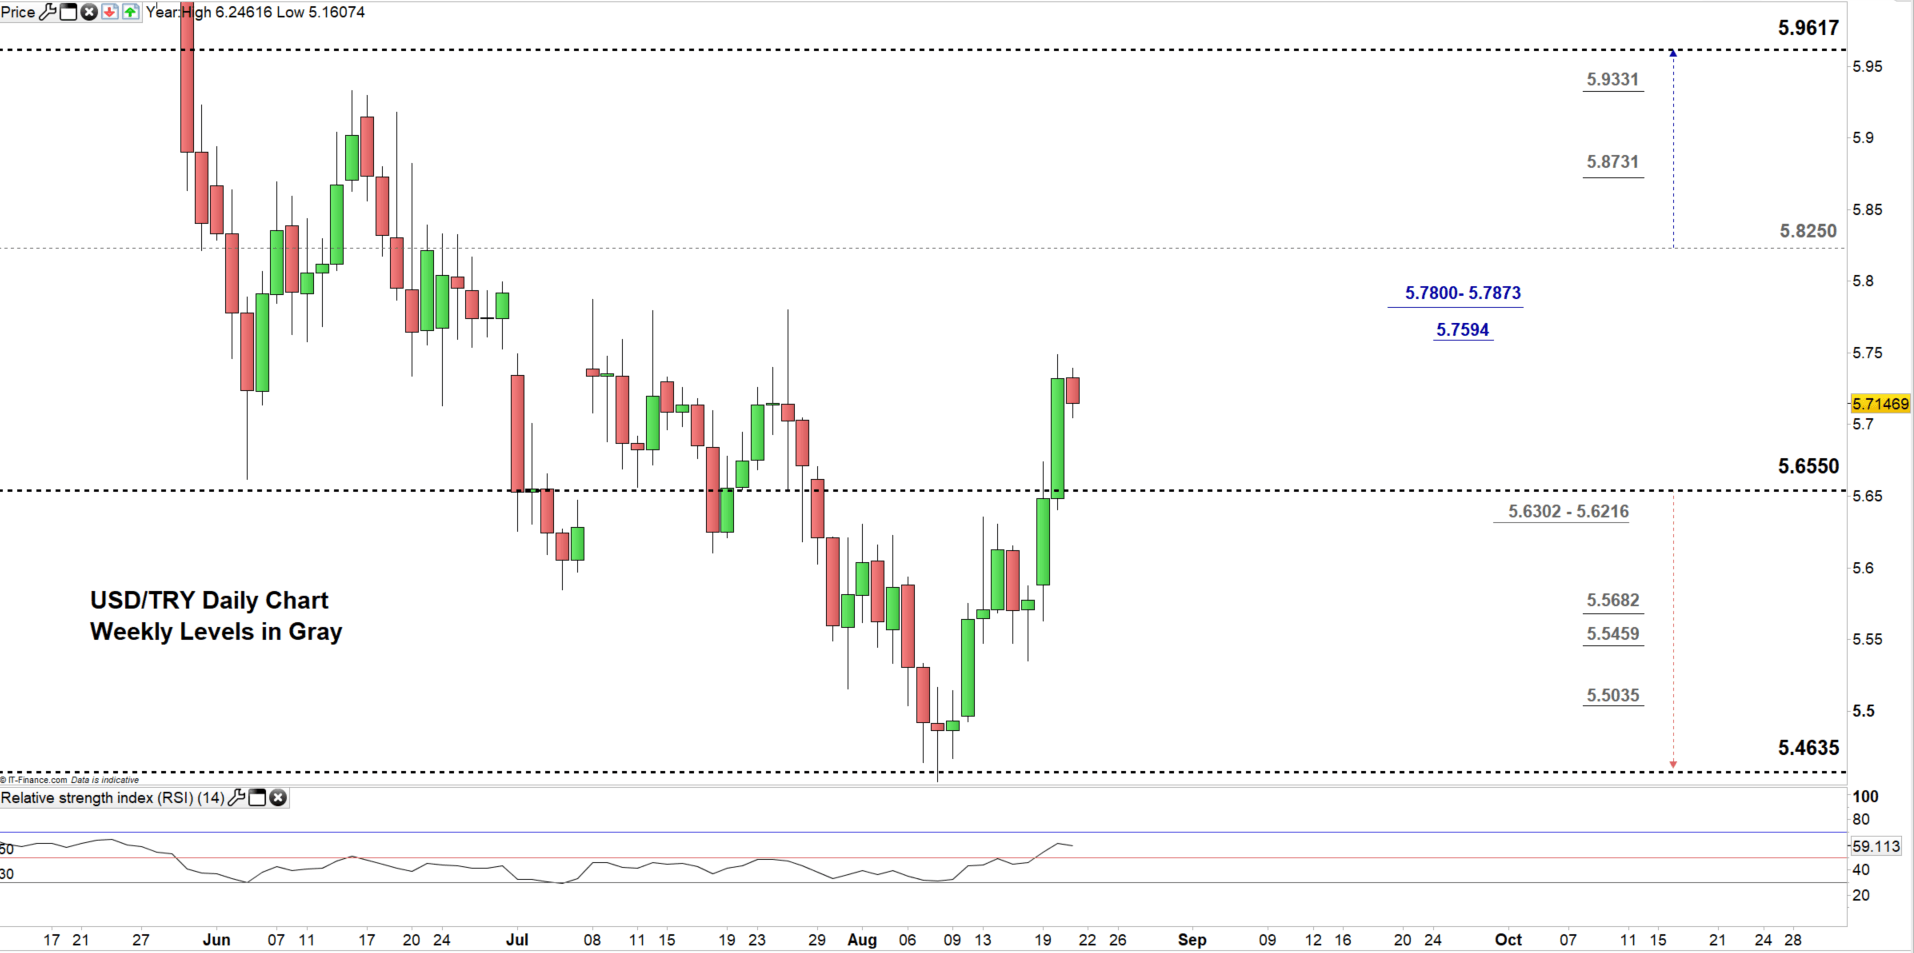
USD/TRY DAILY PRICE CHART (May 25 – AUG 21, 2019) Zoomed In
Looking at the daily chart we notice yesterday USD/TRY moved to the higher trading zone 5.6550 – 5.8250. Currently, the price eyes a test of the high end of this zone.
Thus, a close above the high end may cause a rally towards 5.9617. Nonetheless, the weekly resistance levels underlined on the chart (Zoomed in) should be kept in focus.
On the other hand, any failure in closing above the high end of the zone could press USDTRY towards the low end. Further close below the low end, could mean more bearishness towards 5.4635. The weekly support levels and area marked on the chart need to be watched along the way.
Just getting started? See our Beginners’ Guide for FX traders
USD/TRY Four-HOUR PRICE CHART (July 26, – AUG 21, 2019)
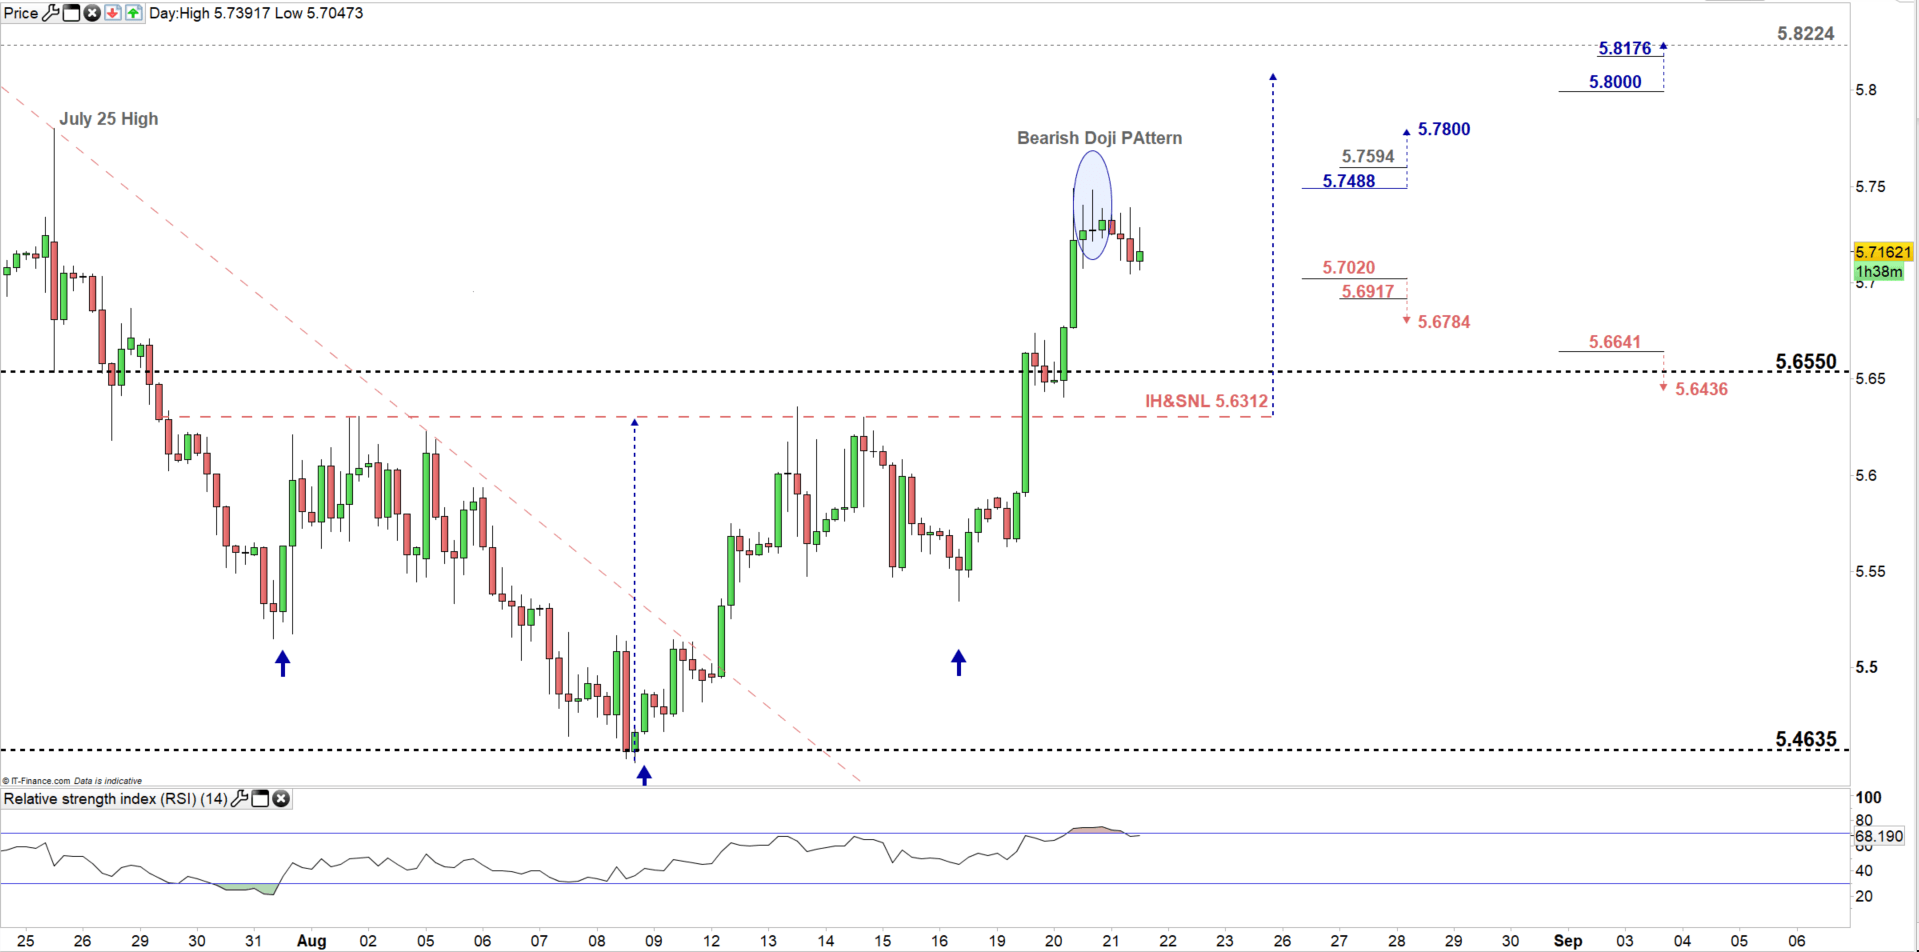
Looking at the four-hour chart, we notice on Monday USD/TRY broke above 5.6312 the neckline of inverted head and shoulders patterned discussed in our last update: Will USD/TRY Rally for a test of the Monthly High?
On the following day USDTRY created a higher high at 5.7488 then the price reversed direction after closing with a bearish Doji pattern. Hence, a break above this high could push the price towards the July 25 high at 5.7800. Although, the daily resistance level underlined on the chart needs to be considered.
On the other hand, if USDTRY breaks below 5.7020, this could send the price towards 5.6784 however, the daily support level underscored on the chart would be worth monitoring.
Written By: Mahmoud Alkudsi
Please feel free to contact me on Twitter: @Malkudsi


