


USD/TRY Price Outlook
Check our latest Q3 forecasts for free and learn what is likely to move the markets at this time of the year.
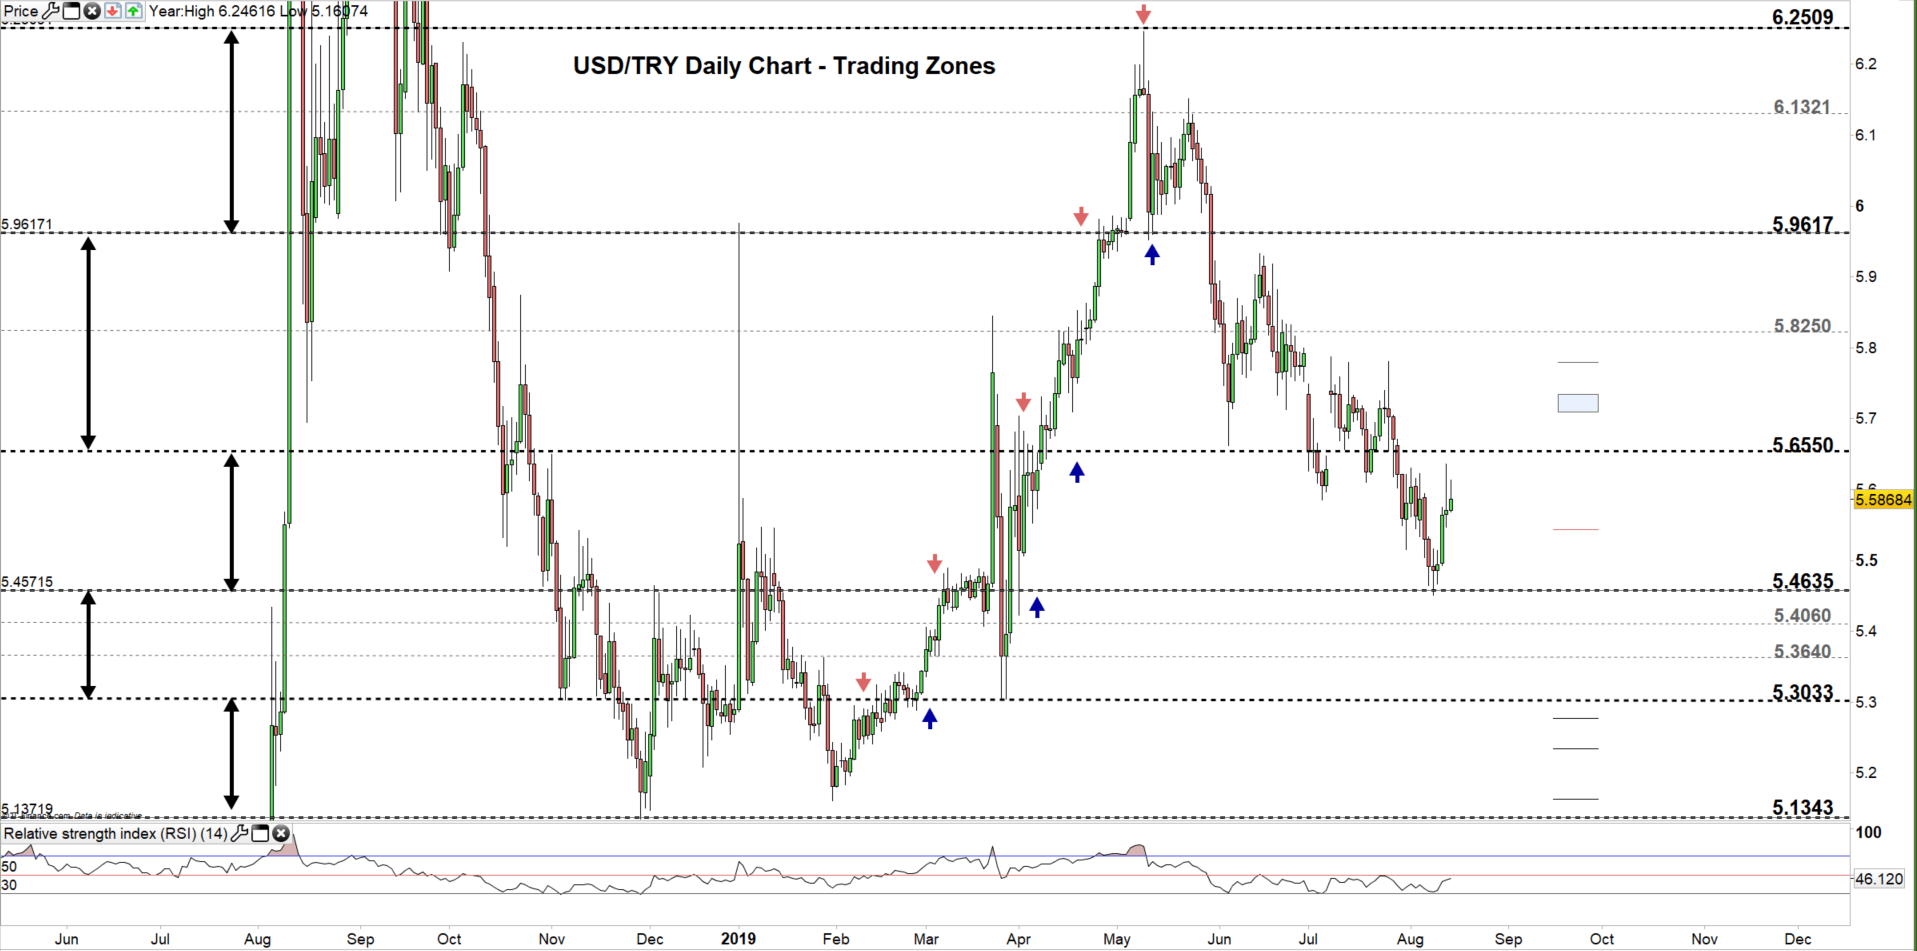
USD/TRY – Correcting Higher
Last week the USD/TRY declined and printed 5.4508- its lowest levels in nearly four months. On Friday the pair closed the weekly candlestick with 1.2% loss.
Yesterday, the price corrected higher creating a higher high at 5.6356, emphasizing the seller’s loss of control at this stage.
This week, the Relative Strength Index (RSI) climbed from 32 to 45 indicating to a weaker bearish of momentum, with a possible start of a bullish momentum contingent on the oscillator crosses above 50.
Having trouble with your trading strategy? Here’s the #1 Mistake That Traders Make
USD/TRY DAILY PRICE CHART (May 3, 2018 – AUG 14, 2019) Zoomed Out
USD/TRY DAILY PRICE CHART (May 25 – AUG 14, 2019) Zoomed In

Looking at the daily chart we notice on Thursday USD/TRY reversed direction nearby the low end of current trading zone 5.4635 – 5.6550 as indicated in our last update: Possible reversal at multi month low
At the start of this week, the pair rallied eyeing the high end of this zone. Thus, a close above the high end may push the price towards 5.8250. Although, the weekly resistance level and area highlighted on the chart (zoomed in) should be considered.
On the other hand, any failure in closing above the high end of the zone could press USDTRY towards the low end. Further close below this level may see the pair trading even lower towards 5.3033. However, the weekly support levels marked on the chart would be worth monitoring.
Just getting started? See our Beginners’ Guide for FX traders
USD/TRY Four-HOUR PRICE CHART (July 26, – AUG 14, 2019)
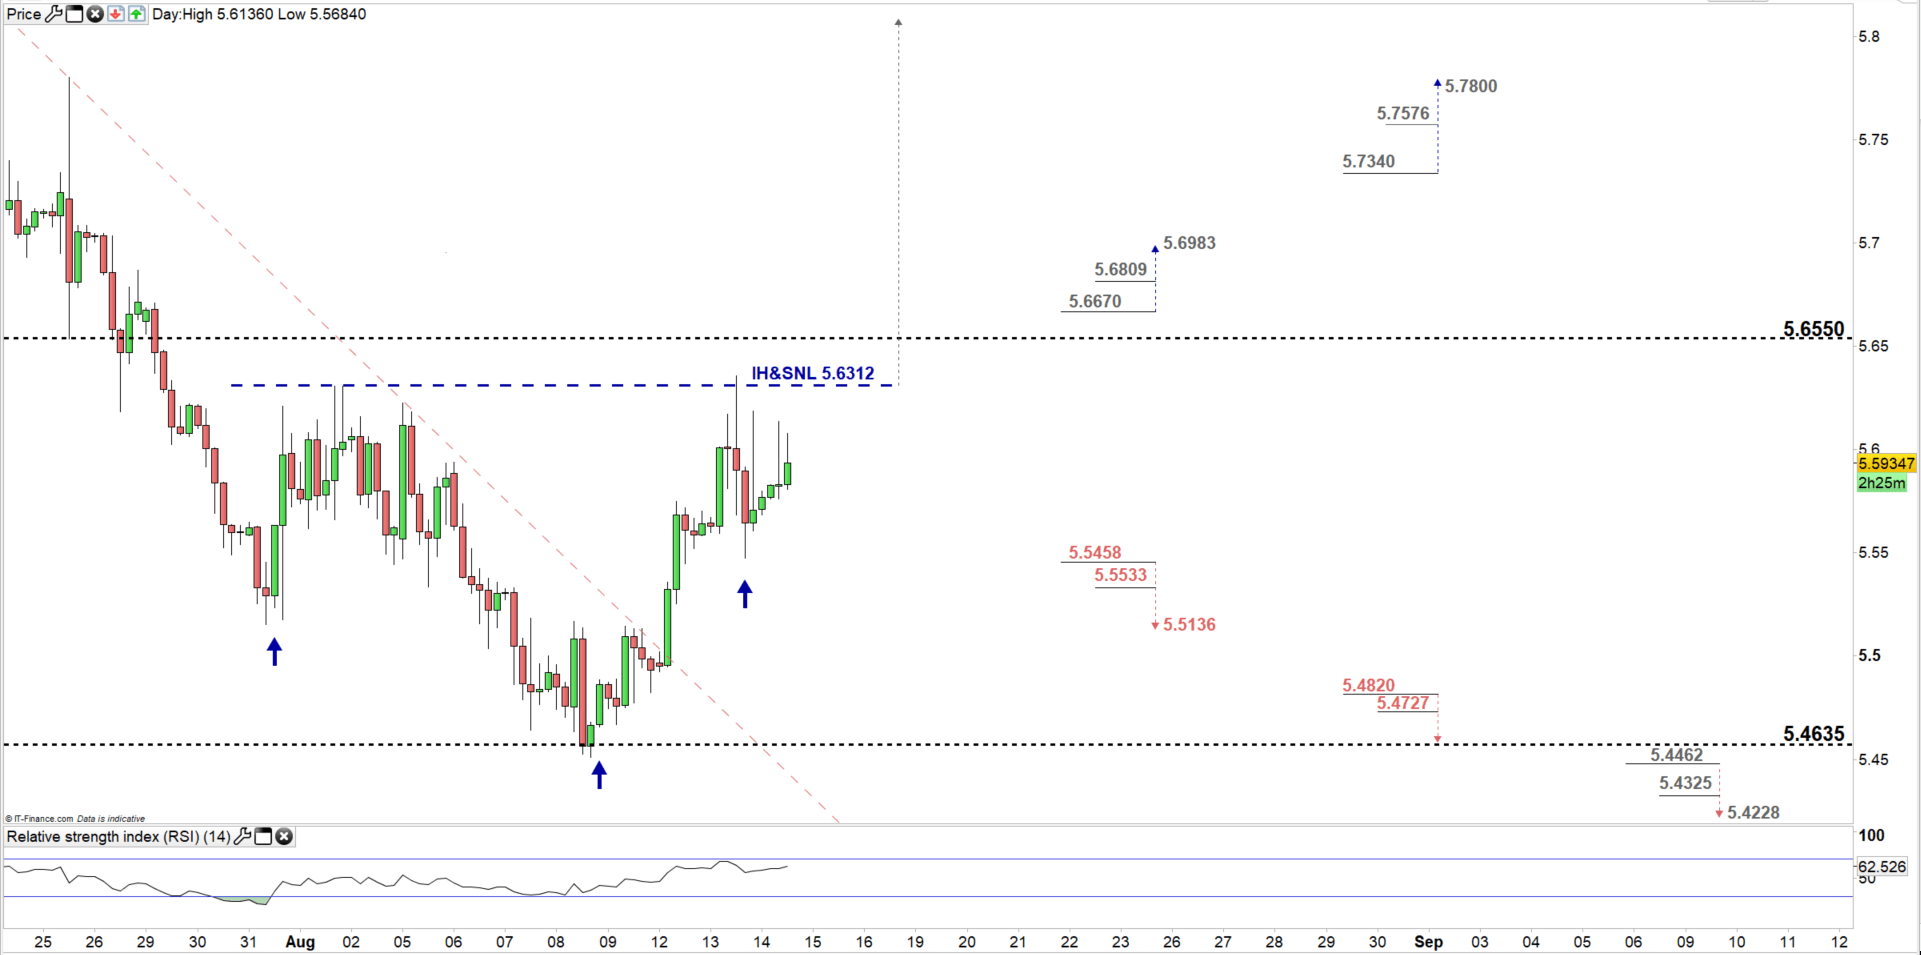
Looking at the four-hour chart, we notice currently USDTRY is creating an inverted head and shoulders pattern where the neckline resides at 5.6312.
Therefore, if the price breaks and remains above the neck line, this could embolden buyers to push the pair for a test of the July 26 high at 5.7800 (Monthly High). Although, the trading zone with the weekly resistance level and area showing on the daily chart should be kept in focus.
A break above 5.6670 may cause a rally towards 5.6983. Nonetheless, the resistance level underlined on the chart needs to be monitored. See the chart to know more about the higher resistance levels the price would face in a further bullish move.
On the flip-side, a break below 5.5458 could lead the price towards 5.5136. However, the support level underscored on the chart should be watched closely. See the chart to find out more about the lower support levels USDTRY would encounter in a further bearish move.
Written By: Mahmoud Alkudsi
Please feel free to contact me on Twitter: @Malkudsi


