


The U.S. Dollar Index (DXY) is positioned is trading at a solid level of resistance with FOMC and NFPs this week. The Euro is holding ground at support, but can it last? GBPUSD is below long-term trend-line support but may have a bounce in it soon. Gold price is holding onto support, but needs to stay there or start moving higher else it risks a pattern reversal that could lead to a swift down-move
Technical Highlights:
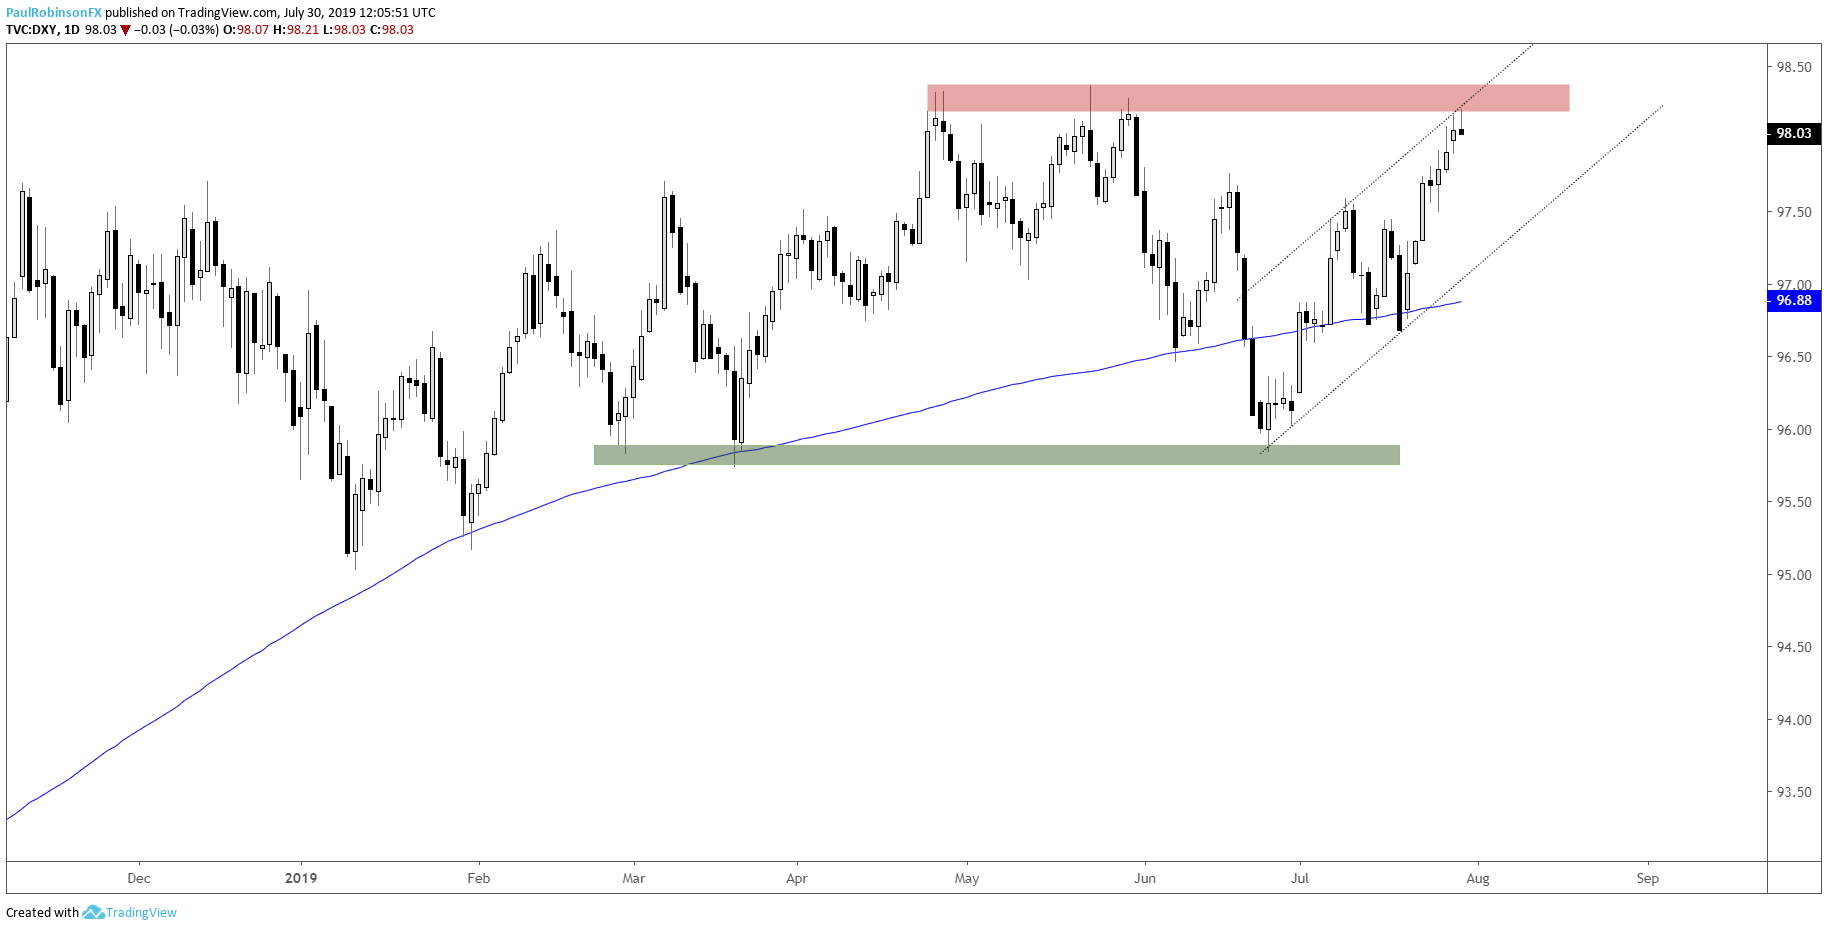
- U.S. Dollar Index (DXY) trading at solid resistance
- EURUSD holding onto support for now
- GBPUSD trading below long-term trend-line
- Gold price still holding onto support
For forecasts and educational guides, check them out on the DailyFX Trading Guides page.
U.S. Dollar Index (DXY) trading at solid resistance
The U.S. Dollar index is trading into resistance from April and May, over the 98-threshold. Heading into tomorrow’s FOMC meeting it could mark an important spot (to a lesser degree of importance, NFPs are on Friday). The pattern has been for extended moves (even smallish ones) to reverse, especially at levels. This makes it a tricky spot in time and price. In a holding pattern for now.
US Dollar Index (DXY) Daily Chart (at big resistance)
EURUSD holding onto support for now
The Euro posted a Long-legged Doji at support over 11100, which is keeping it afloat for now. A bounce may develop, but skeptical on how much power it can have given the general trend/tone. An eventual breakdown seems to be nearing, but need to clear through underside levels and trend-lines down to sub-11000 before momentum can kick in.
EURUSD Daily Chart (gunning for 11100 or worse)

GBPUSD trading below long-term trend-line
Cable is trading below the October 2016 trend-line, working towards lows create in 2016/17. The shot lower form the falling wedge could have gone too far too fast, watch for a snapback soon. Risk/reward from either side of the tape isn’t particularly appealing for new positions.
GBPUSD Daily Chart (Oct ’16 t-line broken)

Gold price still holding onto support
Gold price is trying to lift off the top-side trend-line of a wedge it recently broke down from, breaking out of a smaller wedge that was just built on top of the top-side trend-line. Support is support until it’s not. But a breakdown below the underside trend-line of the broader wedge would be reason to look for gold to go in reverse, and quite possibly with a good amount of force.
Gold 4-hr Chart (breaking out of wedge on top of wedge)

Resources for Forex & CFD Traders
Whether you are a new or an experienced trader, DailyFX has several resources available to help you; indicator for tracking trader sentiment, quarterly trading forecasts, analytical and educational webinars held daily, trading guides to help you improve trading performance, and one specifically for those who are new to forex.
---Written by Paul Robinson, Market Analyst
You can follow Paul on Twitter at @PaulRobinsonFX


