


NORDIC FX, NOK, SEK WEEKLY OUTLOOK
- USDSEK aiming towards key trading range after breaking through rising support
- Underlying bullish bias likely to prevail once fundamental headwind start blowing
- EURSEK appears to be flirting with the notion of retesting rising 2-year support
See our free guide to learn how to use economic news in your trading strategy !
EURSEK TECHNICAL ANALYSIS
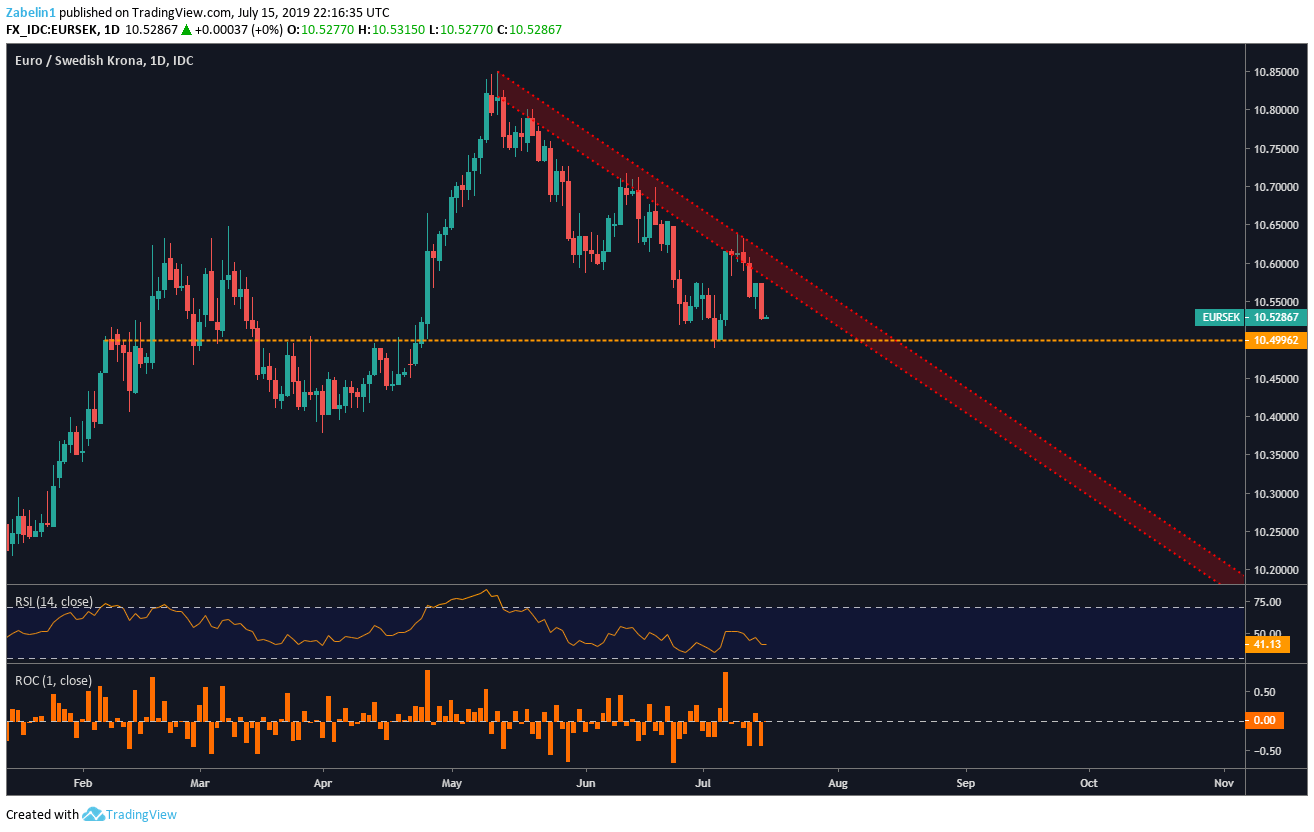
On a daily chart, EURSEK continues to trade below May’s descending resistance channel (red parallel channel). Traders will find themselves at an interesting point when the price ceiling and support at 10.4996 (yellow dotted line) converge. Sellers will likely wait for confirmation with a daily close below descending resistance and the price floor before committing more capital.
EURSEK – Daily Chart
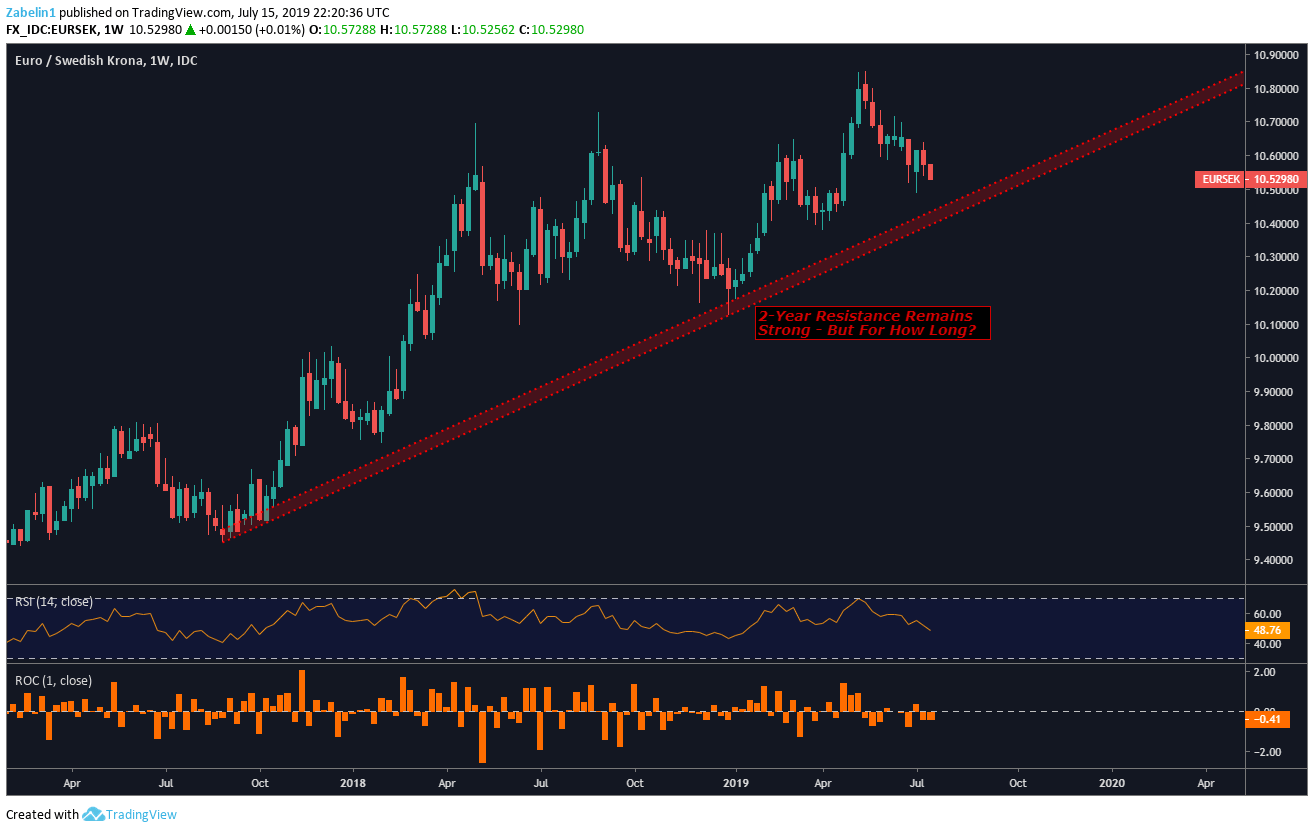
Zooming out to a weekly chart, however, shows an entirely different picture. EURSEK has been on a steady incline since August 2017 (red parallel channel). The last time the pair came close to testing the lower level of support was in December of 2018. Despite being on an uptrend, the pair is once again approaching the critical support zone. A break below it with follow-through may cause sellers to double down.
EURSEK – Weekly Chart
USDSEK TECHNICAL ANALYSIS
USDSEK has once again broken through 18-month rising support after briefly popping its head up again in early July (red parallel channel). The pair is now looking to potentially test a familiar congestive range between 9.2533-9.3110 (red dotted lines). Traders with short positions may wait to add exposure until after USDSEK has broken below the lower lip of the congestive range with follow through.
USDSEK – Daily Chart

Despite the temporary deviation from the broad uptrend, the underlying bias suggests a bullish outlook. Fundamentals supportive of a stronger US Dollar will likely be a tailwind behind the pair’s likely continued ascendancy at least until year-end. A close above the upper lip of the support channel with follow through may prompt USDSEK traders to enter long positions if they are convinced the deviation is over.
SWEDISH KRONA, NORWEGIAN KRONE TRADING RESOURCES
- Join a freewebinar and have your trading questions answered
- Just getting started? See our beginners’ guide for FX traders
- Having trouble with your strategy? Here’s the #1 mistake that traders make
--- Written by Dimitri Zabelin, Jr Currency Analyst for DailyFX.com
To contact Dimitri, use the comments section below or @ZabelinDimitri on Twitter


