


Platinum Price Forecast
- Platinum charts and analysis.
- Platinum sellers might be preparing to take over.
Have you checked our latest trading guides for USD and Gold? Download for free Q3 Main Currencies and Commodities Forecasts
Platinum Price – Exhausted Buyers
On June 28, Platinum rallied and printed $840.9 - its highest level in six weeks. On Monday, the price continued its rally, however; it slipped after closing below $837.0.
Alongside, the Relative Strength Index (RSI) dropped from 62 to 54 indicating the weakness of the upward momentum. Its worth noting that if the oscillator dips below 50 it means a possible start for a downward momentum.
Having trouble with your trading strategy? Here’s the #1 Mistake That Traders Make
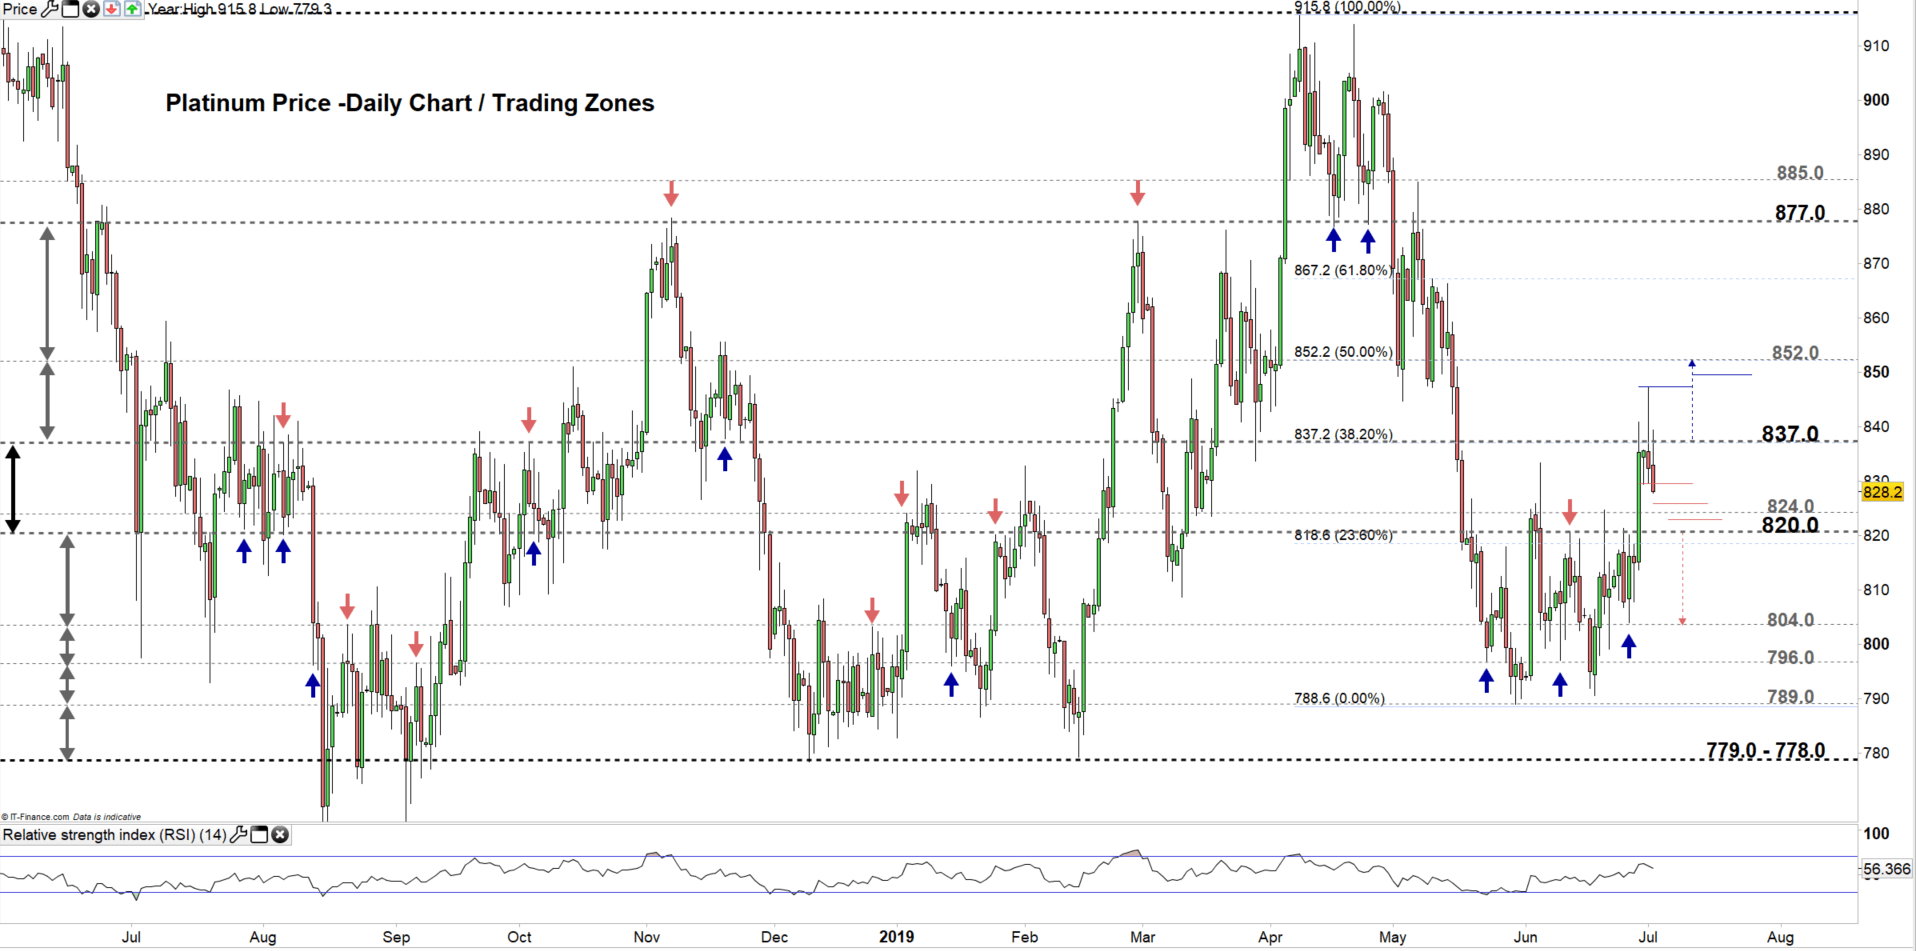
Platinum DAILY PRICE CHART (June 1, 2018 – JUL 2, 2019) Zoomed Out
Platinum DAILY PRICE CHART (Apr 8, 2018 – JUL 2, 2019) Zoomed In
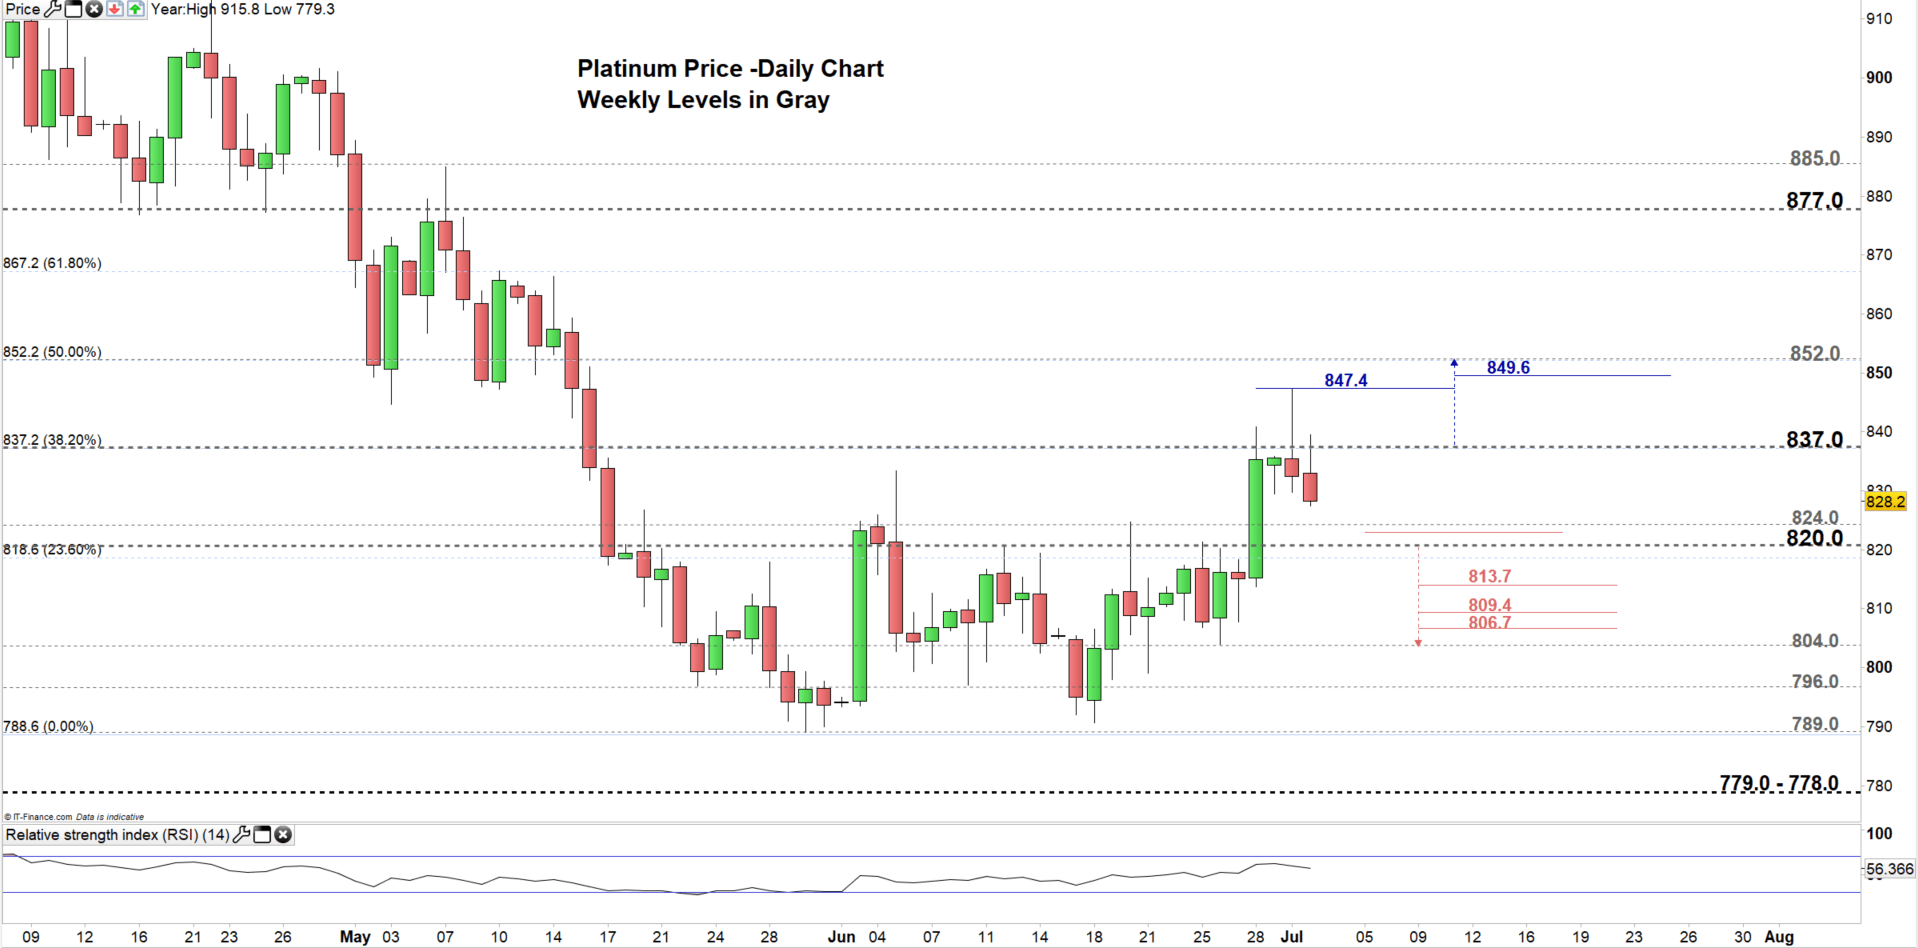
Looking at the daily chart we notice yesterday Platinum failed to close above $837.0 after failing on Friday, showing lack of impulse to move to the higher trading zone. The price could head to the low end of the current trading zone at $820.0 -$837.0.
A close below the low end of the aforementioned trading zone could send the price even lower towards $804.0, however; the daily supports highlighted on the chart would be worth monitoring.
On the other hand, a close above the high end of the trading zone may cause the price to rally towards $852.0, although, the daily resistance levels mentioned on the chart need to be considered.
Just getting started? See our Beginners’ Guide for FX traders
Platinum Four-HOUR PRICE CHART (June 19, 2019- JUL 2, 2019)

Looking at the four-hour chart we notice Platinum broke below the neckline of head and shoulders pattern residing at $829.8. This pattern suggests the price might head towards the June 28 low at $813.7 contingent on Platinum remains below the aforementioned neckline, although; the daily support levels marked on the chart should be watched closely. See the chart for more details if the selloff continues below the June 28 Low.
On the flipside, a break above the right shoulder at $839.5 might send the price to test the head at $847.4 nonetheless, the daily resistance level underlined on the chart needs to be kept in focus. See the chart to know more about the key levels above $847.4.
Written By: Mahmoud Alkudsi
Please feel free to contact me on Twitter: @Malkudsi


