


Platinum Price Forecast
- Platinum charts and analysis.
- Platinum Price consolidating in a narrow trading zone.
Did we get it right with our forecasts? Find out more for free from our Q2 Gold and main currencies forecasts
Platinum Price – The Buyers Struggle
On June 20, Platinum rallied creating a higher high at $823.9 however, it slipped back showing the price weakness to rally even higher. Yesterday, same process repeated nonetheless, without enough impulse to test the mentioned high.
On June 24, the Relative Strength Index (RSI) corssed above 50 however, it U-turned reflecting the lack of momentum to kick start an upward trend.
Having trouble with your trading strategy? Here’s the #1 Mistake That Traders Make
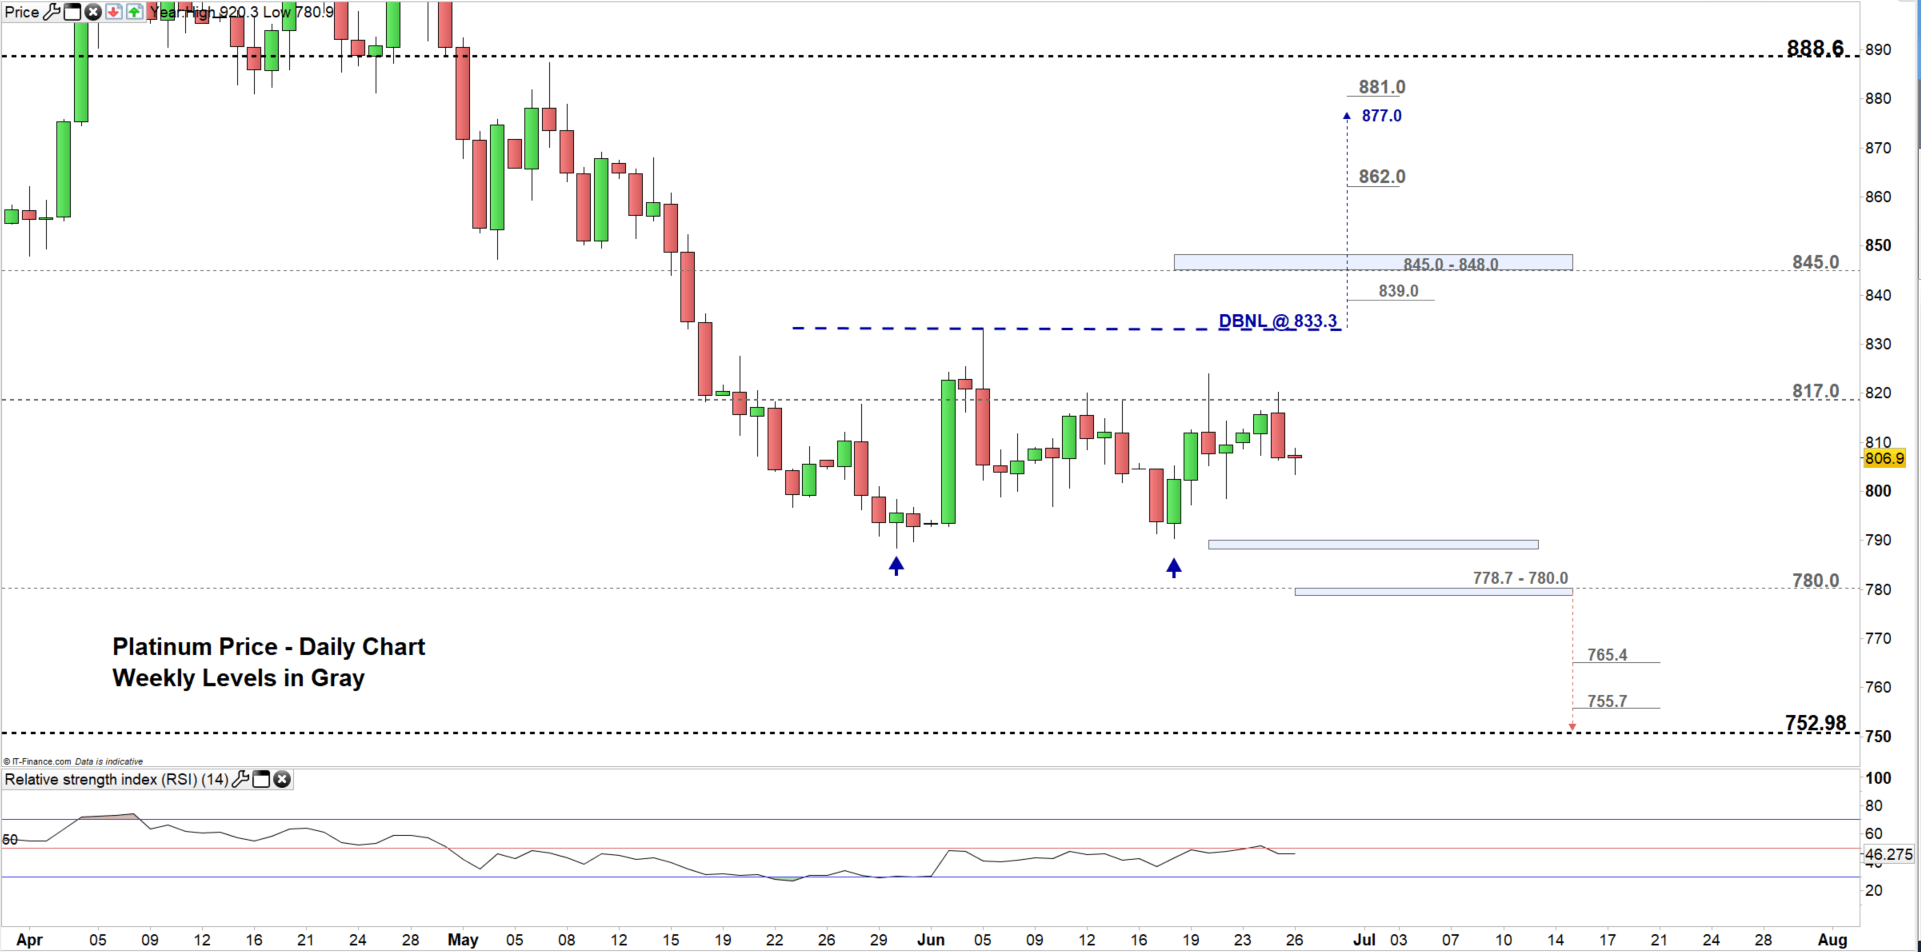
Platinum DAILY PRICE CHART (APR 9, 2019 – JUn 26, 2019) Zoomed In
Platinum DAILY PRICE CHART (DEC 7, 2017 – JUn 26, 2019) Zoomed OUT
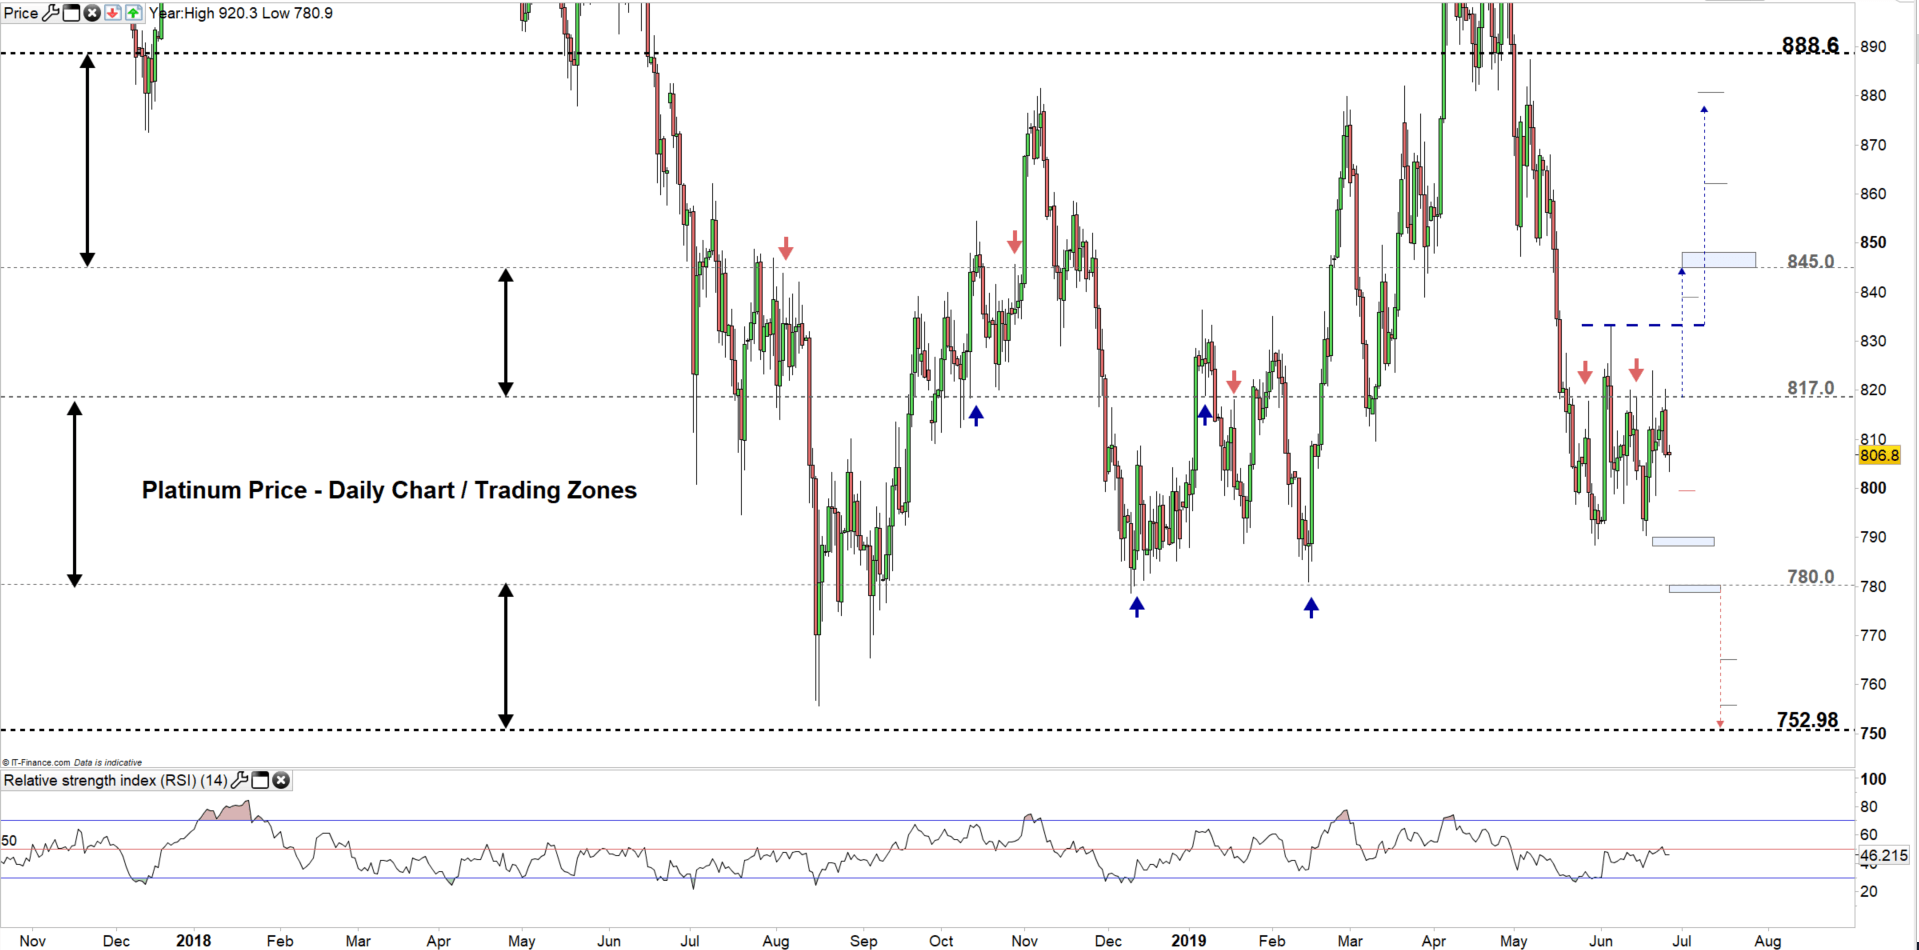
Looking at the daily chart we notice on June 5 Platinum moved to the lower trading zone $780.0 - $817.0. Since then the price has stuck in a sideways pattern and failed in four different times to close above the higher end of this trading zone.
Therefore, any close above the higher end, may lead Platinum to test the double bottom neckline residing at $833.3. It’s worth noting that if the price breaks and remains above the neck line it might trade even higher towards $877.0. However, the weekly resistance zone and levels underlined on the chart need to be watched closely.
A close below $788.5 would negate the double bottom formation and could see the price trading towards the weekly support zone at $780.0 – $778.7. See the chart to find out more about the significant weekly supports the sellers would encounter below $778.7.
Just getting started? See our Beginners’ Guide for FX traders
Platinum Four-HOUR PRICE CHART (May27, 2019- JUN 12, 2019)
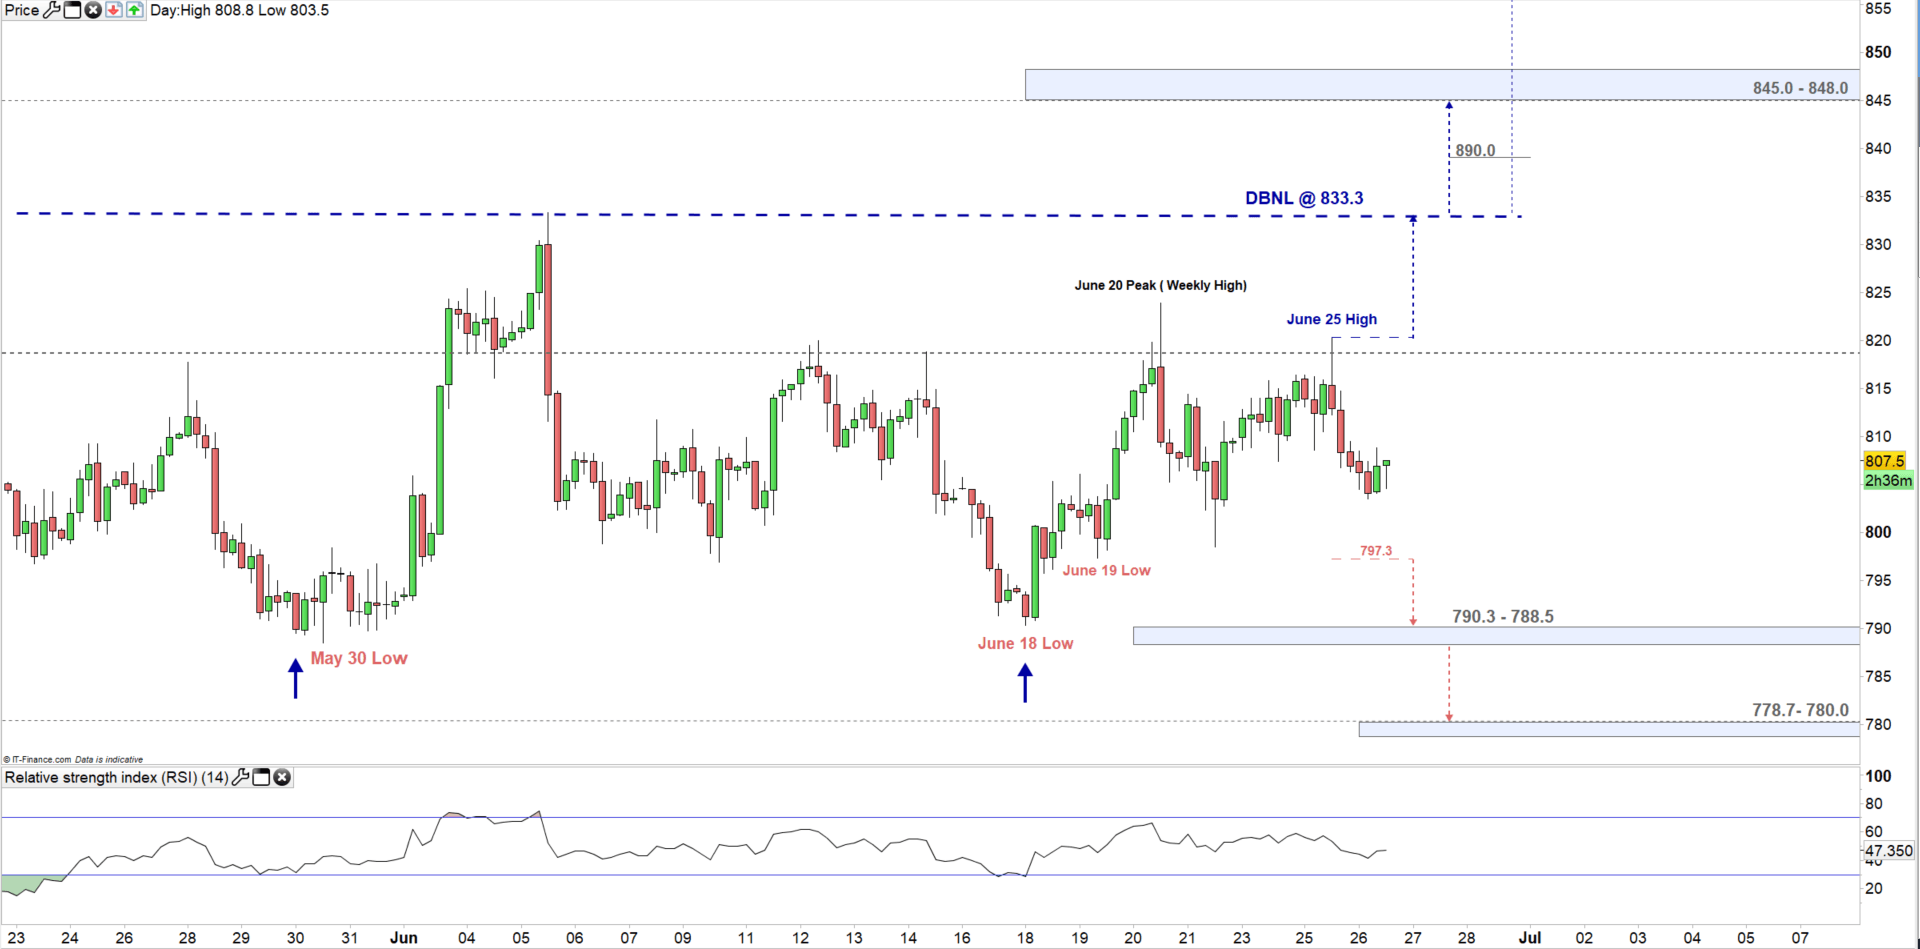
Looking at the four-hour chart we notice Platinum rallied yesterday carving out a higher high at $820.3. Hence, any break above this high could rally the price towards the aforementioned neck line. Although, the June 20 peak (weekly high) at $823.9 needs to be kept in focus. See the chart to know more about the key levels if the rally carries on above the neck line.
On the other hand, we notice Platinum rebounded on June 19 from $797.3 and since then never tested this level. Therefore, any break below this threshold might send the price to test the zone from the June 18 low at $790.3 to the May 30 low at $788.5. See the chart to check on the next weekly support zone.
Written By: Mahmoud Alkudsi
Please feel free to contact me on Twitter: @Malkudsi


