


Copper Price Forecast
- Copper price looking ahead to Trump and Xi meeting this week amid stalled trade talks.
- Paused upward trend .
Did we get it right with our various forecasts? Find out more for free from our Q2 USD and main currencies forecasts
Copper Price – Higher but Without Momentum
On June 17 the sellers failed to press Copper To probe two -year low. On the following day the price opened with an upward gap then rallied breaking above the June 11 high at $5,956.
The Relative Strength Index on June 20 crossed above 50 but remained flat after, reflecting the lack of momentum to push the price higher.
Having trouble with your trading strategy? Here’s the #1 Mistake That Traders Make
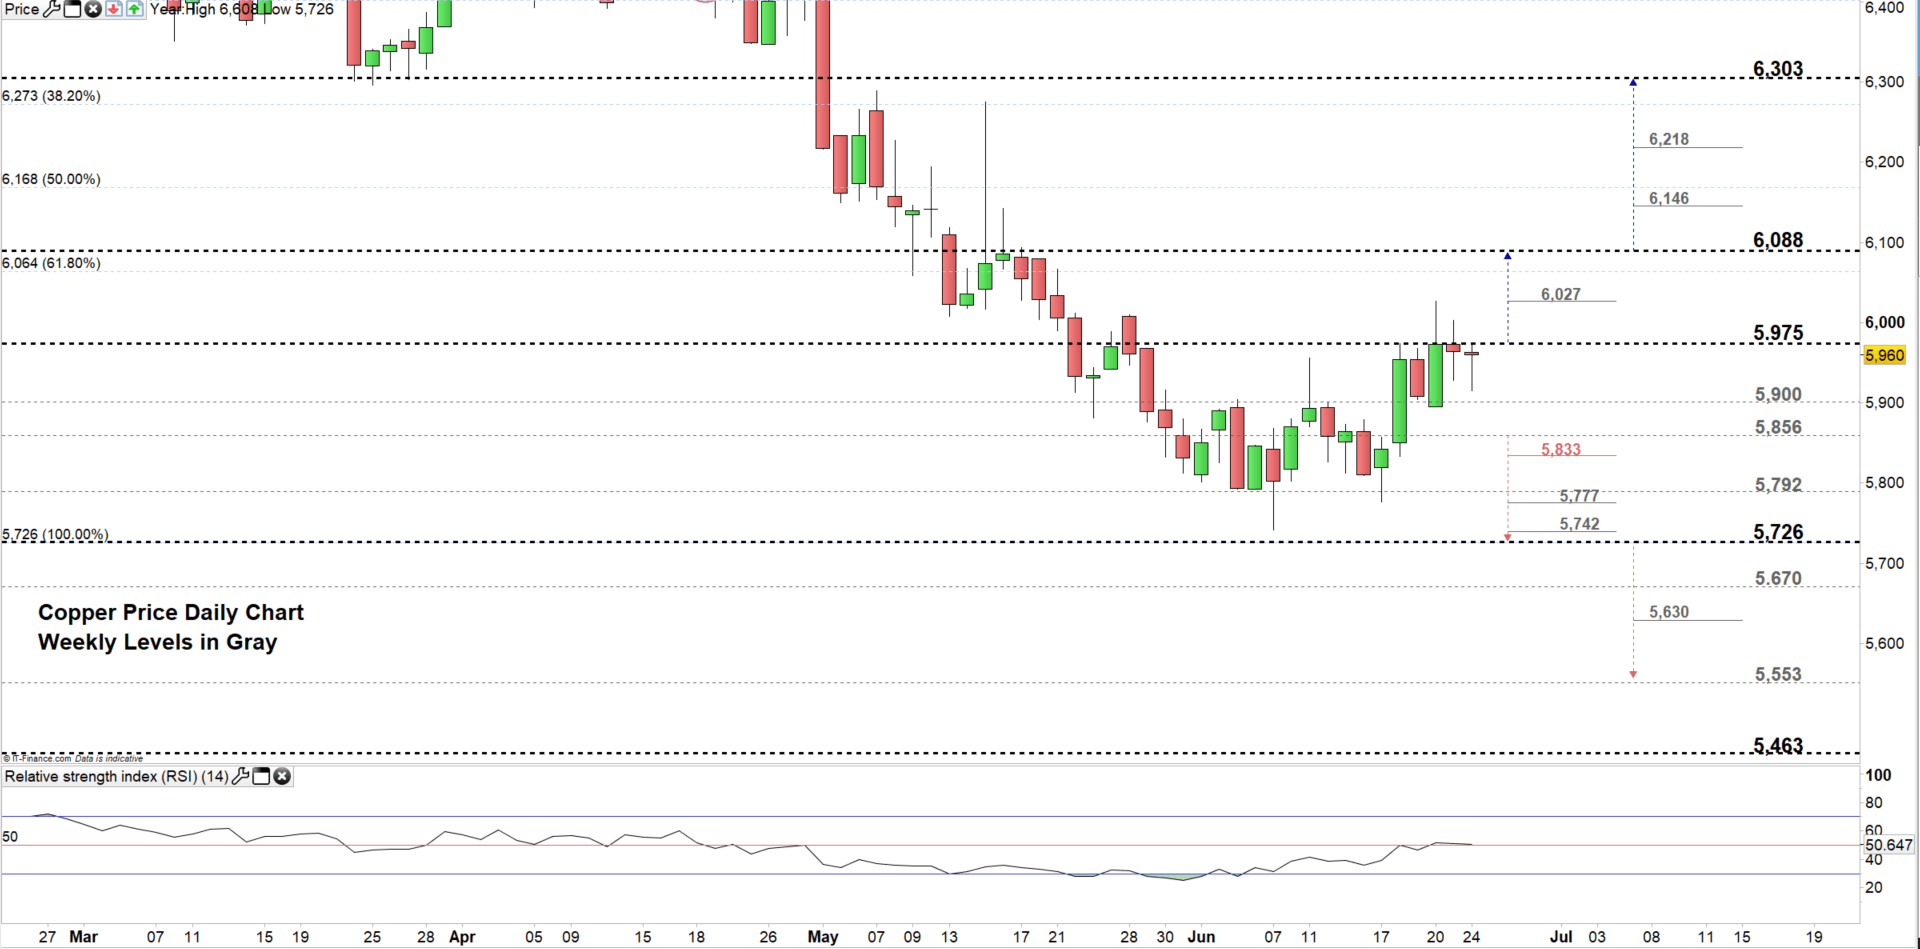
Copper DAILY PRICE CHART (Mar 8, 2019 – JUn 24, 2019) Zoomed In
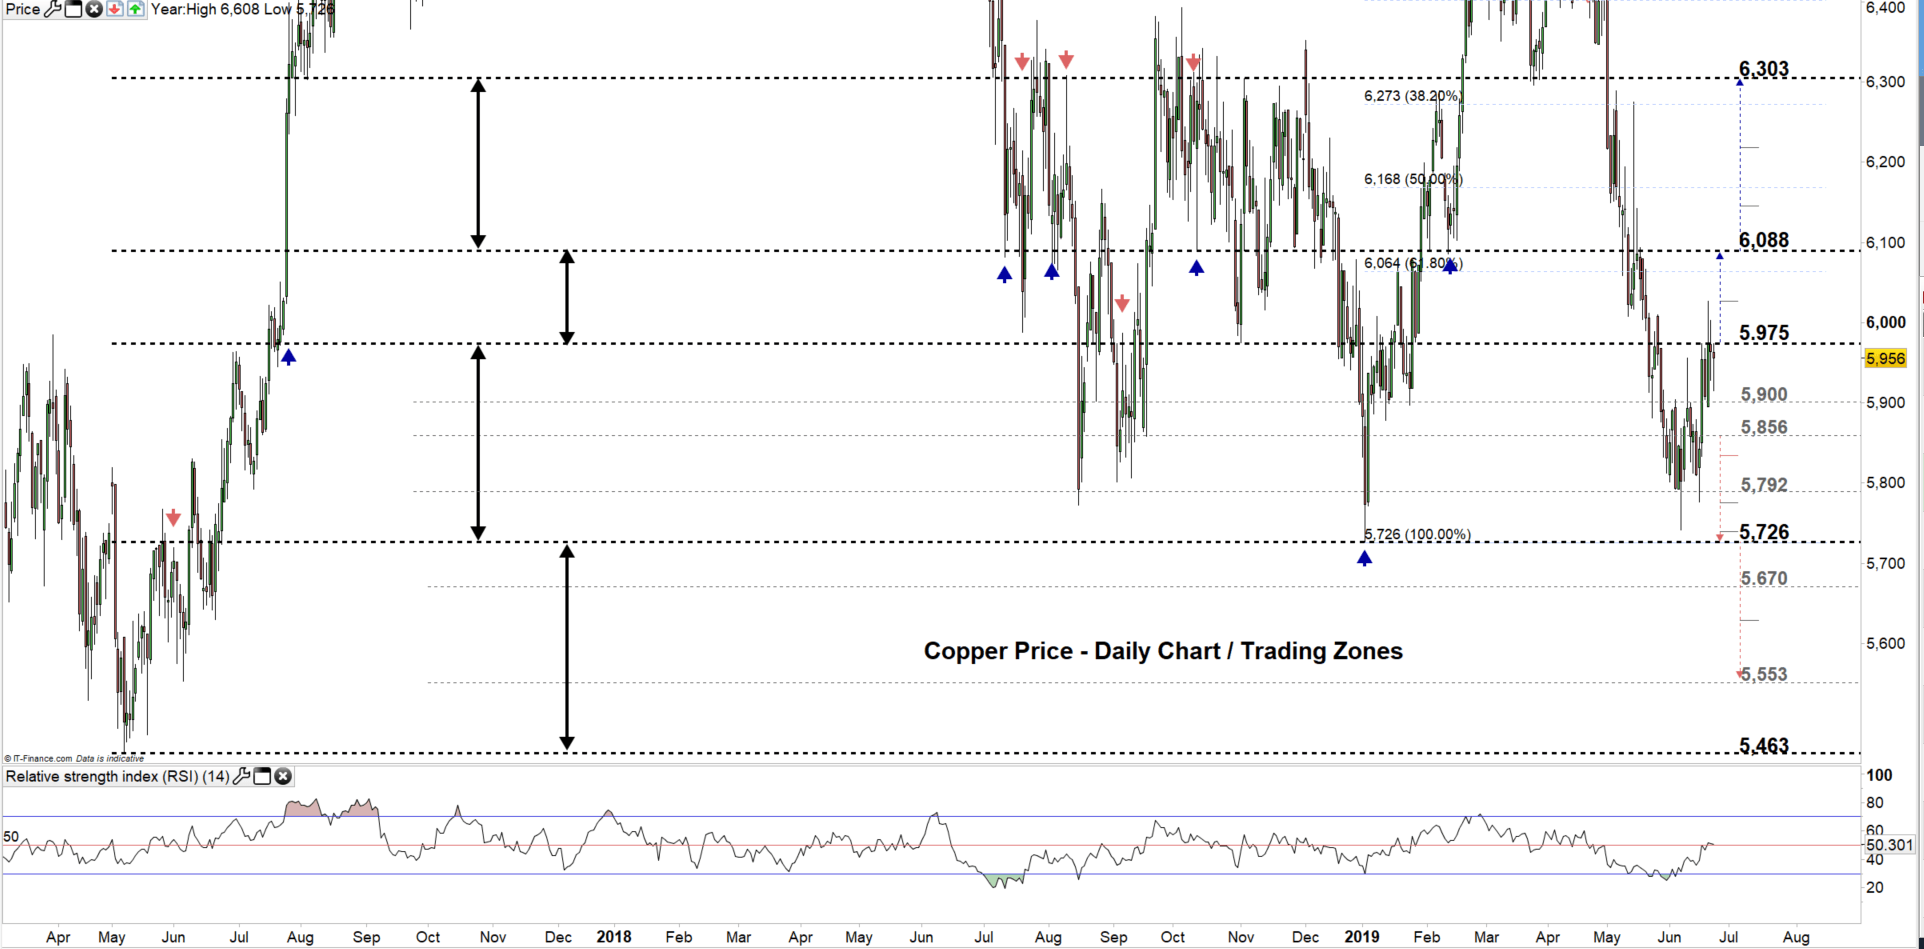
Copper DAILY PRICE CHART (DEC 7, 2016 – JUn 24, 2019) Zoomed OUT
Looking at the daily chart we notice last week Copper tested $5,975 and failed twice in closing above this level. This suggests the price might fall towards $5,856 contingent on clearing the daily support at $5,900. See the chart for more key levels if Copper closes below $5,856.
In turn, if Copper closes above $5,975 this might rally the price towards $6,088 although the weekly resistance highlighted on the chart should be watched closely. See the chart to find out more about the next significant resistance to watch if the price closes above $6,088.
Just getting started? See our Beginners’ Guide for FX traders
CoPper Four-HOUR PRICE CHART (May 6, 2019- JUN 24, 2019)

Looking at the four-hour chart, we notice Copper on June 17 rebounded then started an upward trend carving out higher highs with higher lows however, this trend stalled on June 20 after peaking at $6,027.
The price could correct lower if breaks below the June 20 trough at $5,895. This could lead Copper towards the June 18 low at $5,833 contingent on clearing the daily support at $5,856. See the chart to find out more if the selloff continues.
On the other hand, the uptrend might resume if Copper breaks above the aforementioned June 20 peak and could head towards $6,088 although, the resistance at 61.8% Fibonacci retracement at $6,064 needs to be monitored. See the chart to know more about the key levels if the buyers continued rallying the price.
Written By: Mahmoud Alkudsi
Please feel free to contact me on Twitter: @Malkudsi


