


Palladium Price Forecast
- Palladium charts and analysis.
- Palladium price trading higher.
Did we get it right with our various forecasts? Find out more for free from our Q2 USD and main currencies forecasts
Palladium Price Takes off
On May 22, Palladium price corrected higher after carving out a higher low at $1.299.0 On May 30 the price leaned even higher creating a higher high at $1,380.5. The price created another lower high on June 3 showing clear intentions from the bulls to take charge.
On June 6, the Relative Strength Index (RSI) crossed above 50 starting a bullish momentum.
Having trouble with your trading strategy? Here’s the #1 Mistake That Traders Make
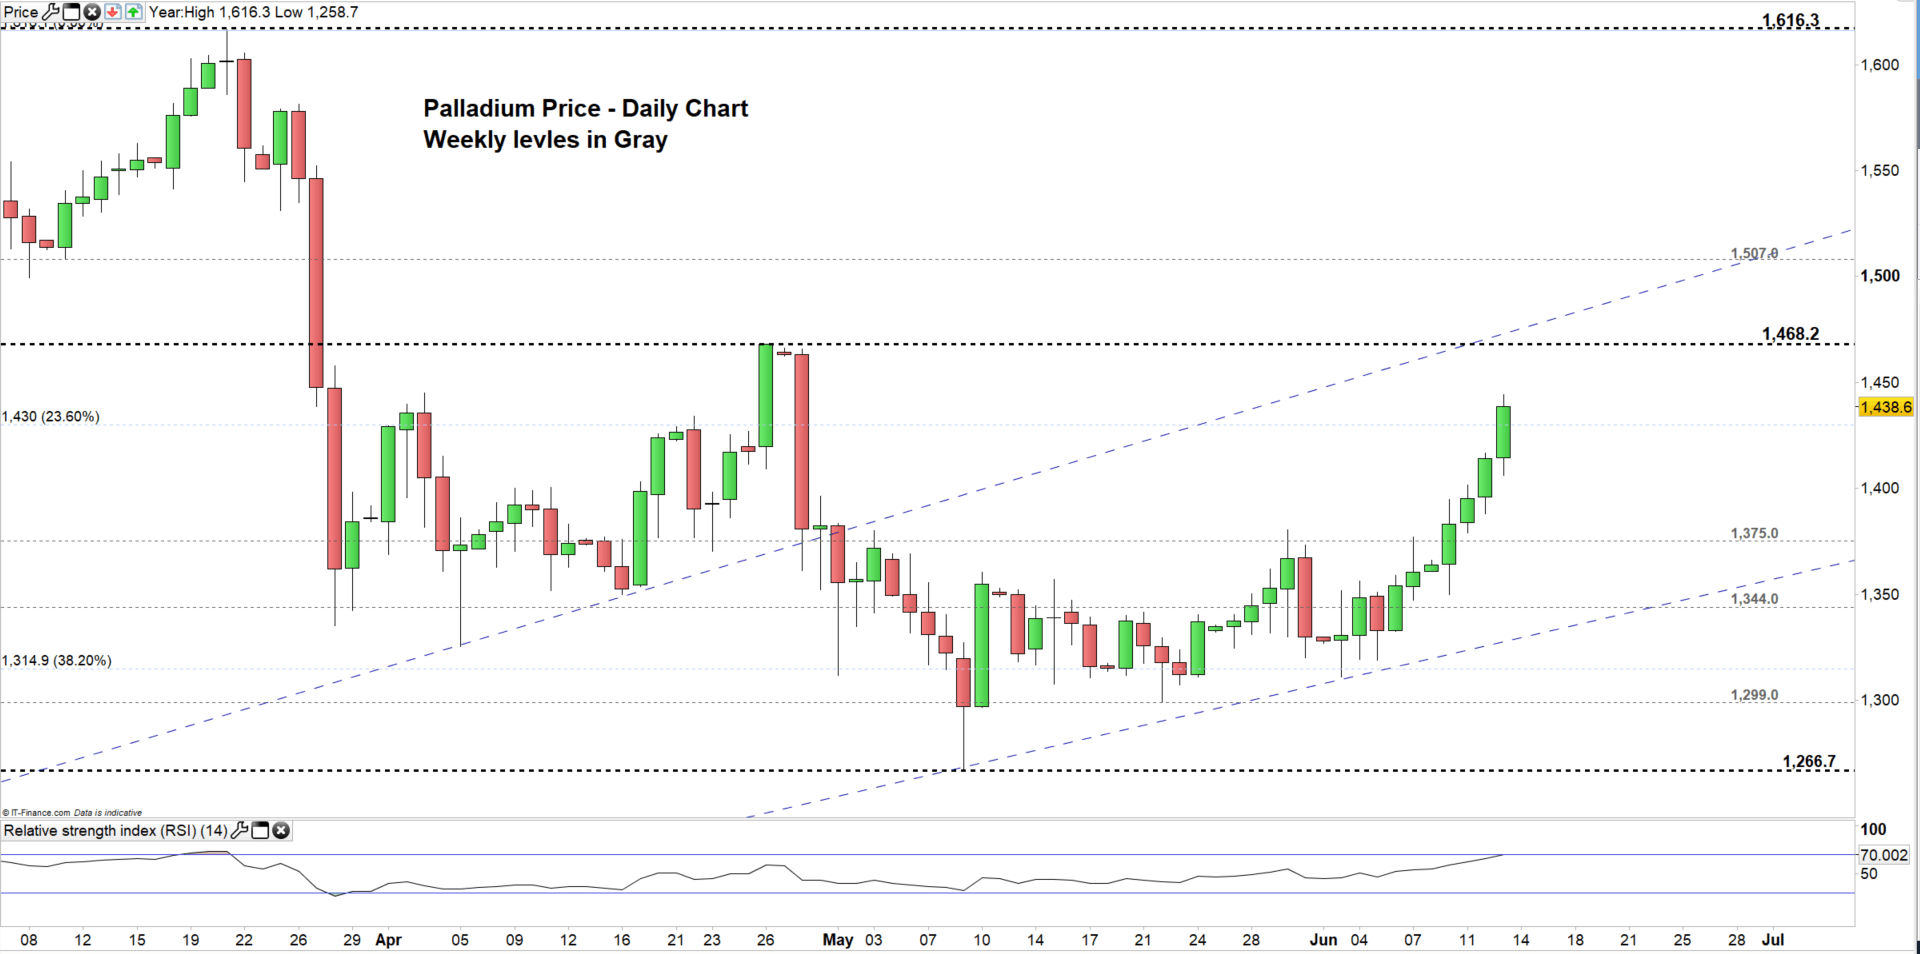
Palladium DAILY PRICE CHART (Mar 7, 2019 – JUn 13, 2019) Zoomed In
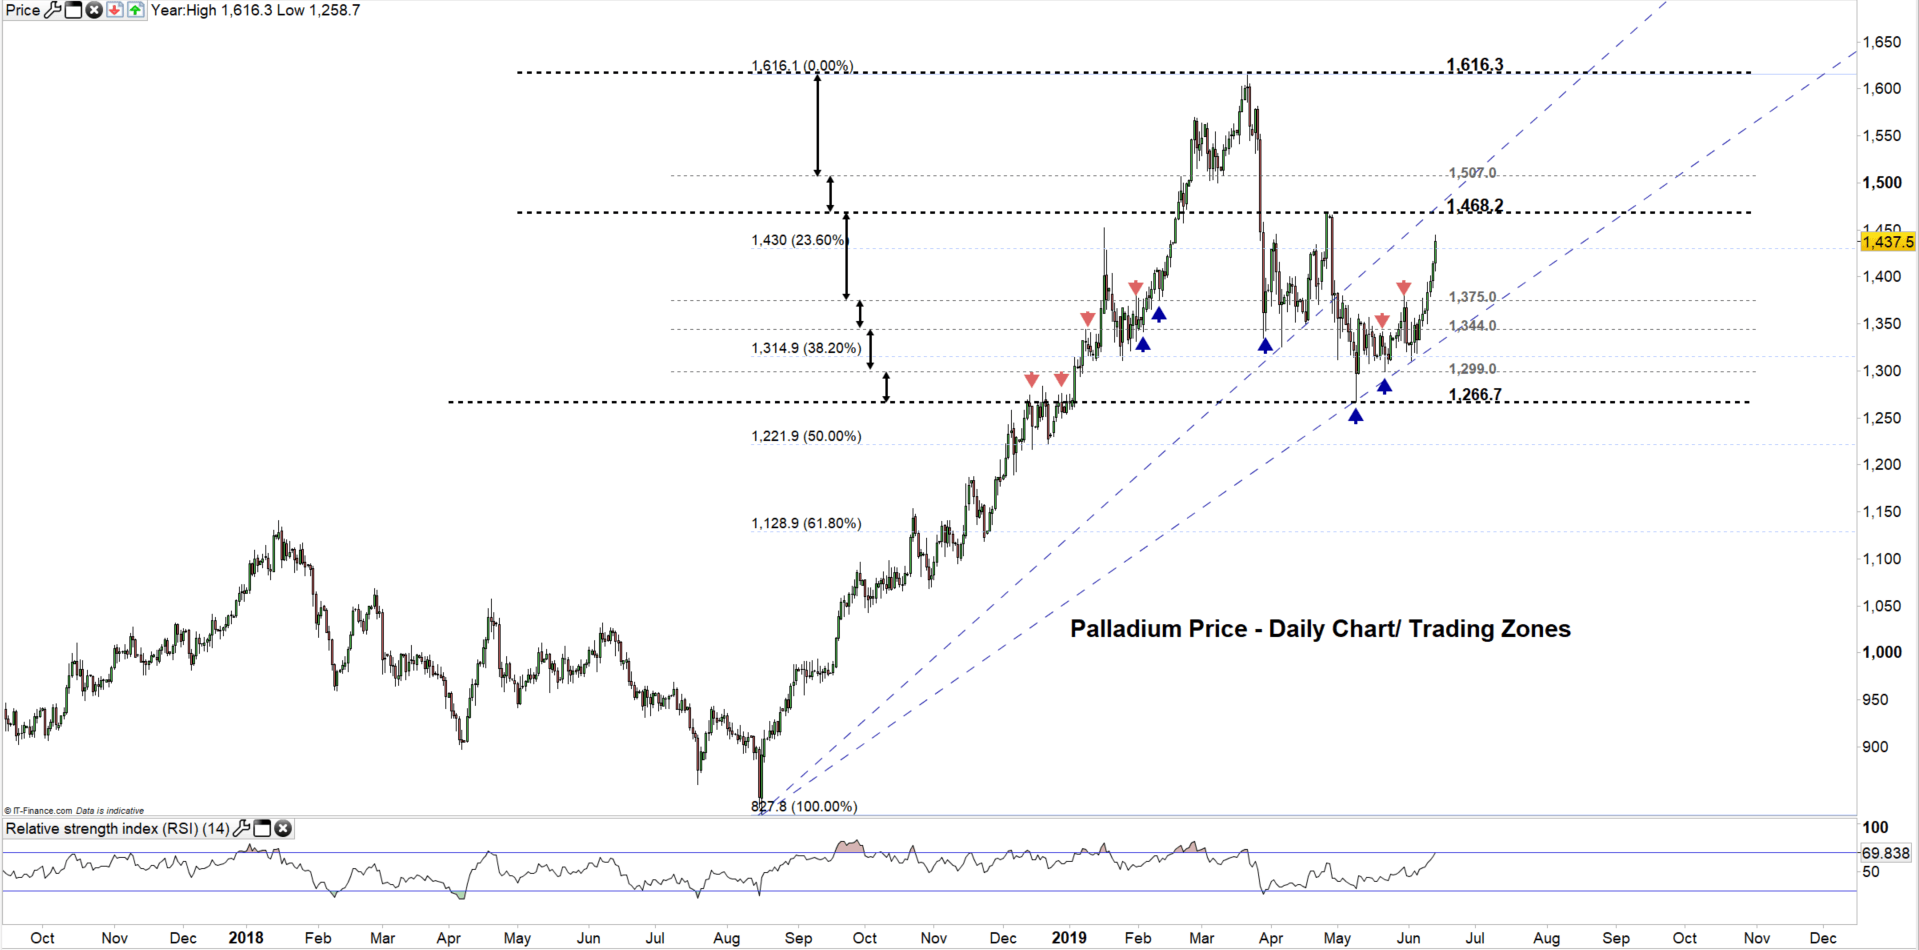
Palladium DAILY PRICE CHART (JUN 4, 2018 – JUn 13, 2019) Zoomed OUT
Looking at the daily chart we notice Palladium on Jun 10 closed above $1,375.0 eying a rally towards the April 26 high at $1,468.2. Therefore, any close above this high could mean more bullishness towards $ 1,507.0. However, the daily resistance at $1,500.0 is worth monitoring.
On the flipside, if Palladium fails to close above $1,468.2 this could send the price lower towards $1,375.0. Although, the daily supports at 23.6% Fibonacci retracement at $1,430 and $1,395.6 should be monitored.
Just getting started? See our Beginners’ Guide for FX traders
Palladium Four-HOUR PRICE CHART (May 28, 2019- JUN 13, 2019)
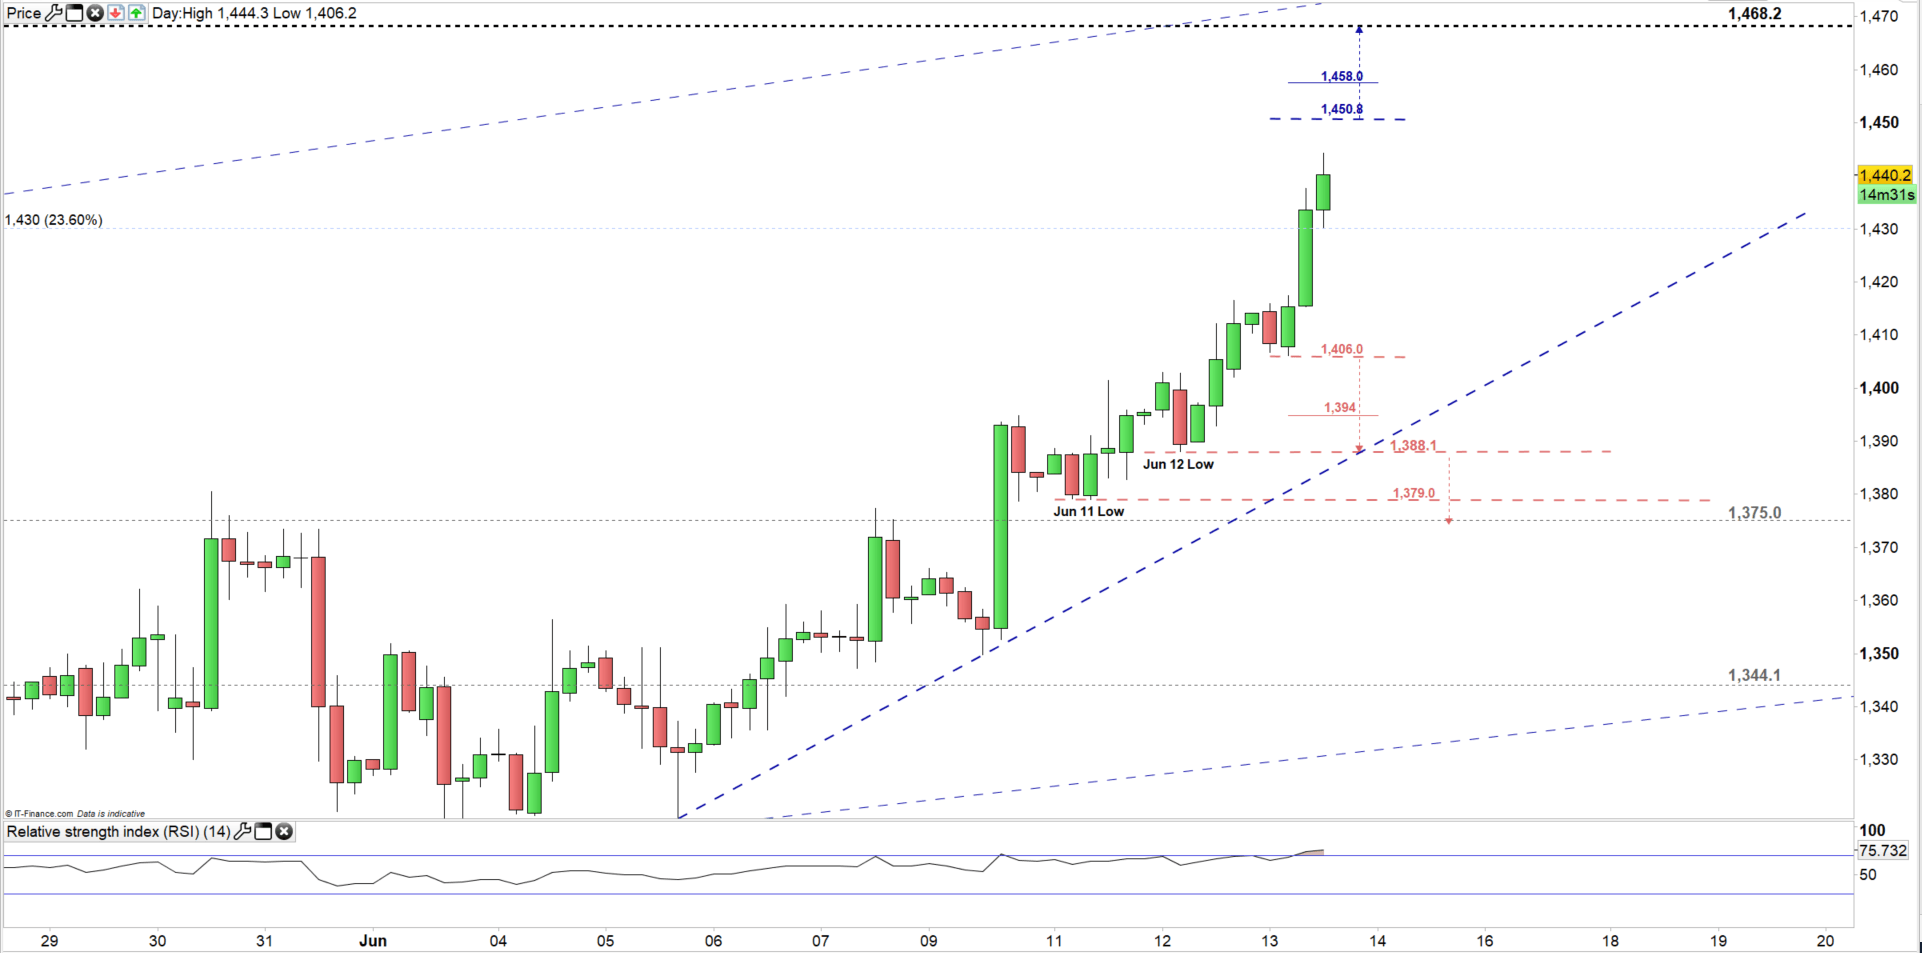
Looking at the four- hour chart we notice Palladium started upward trend on Jun 5 creating higher highs and higher lows. On June 11 the uptrend started to accelerate craving out steeper higher lows emphasizing the strength of the bullish move.
A break above the daily resistance at $1,450.8 may lead the price to test the 26 of April peak at $1468.2. Although, the daily resistance at $1458.0 should be kept in focus.
On the other hand, any break below $1,406.0 could send the price towards $1,388.1 (the June 12 low). However, the daily support level at $1,394 need to be watched closely. See the chart for the key levels if the price trades below the June 12 low.
Written By: Mahmoud Alkudsi
Please feel free to contact me on Twitter: @Malkudsi


