


Platinum Price Forecast
- Platinum charts and analysis.
- Platinum price, looking to start a bullish move.
Did we get it right with our various forecasts? Find out more for free from our Q2 USD and main currencies forecasts
Platinum Price – Correcting Higher
On Jun 5, platinum ended its bearish movement carving out a higher high at $833.3. On Jun 10 Platinum created a higher low at $796.9 leaning to the upside.
Alongside, the Relative Strength Index (RSI) pointed higher from 40 to 47.5 nearing the 50 level. Its worth noting that a cross above 50 would mean a start for a possible bullish trend.
Having trouble with your trading strategy? Here’s the #1 Mistake That Traders Make
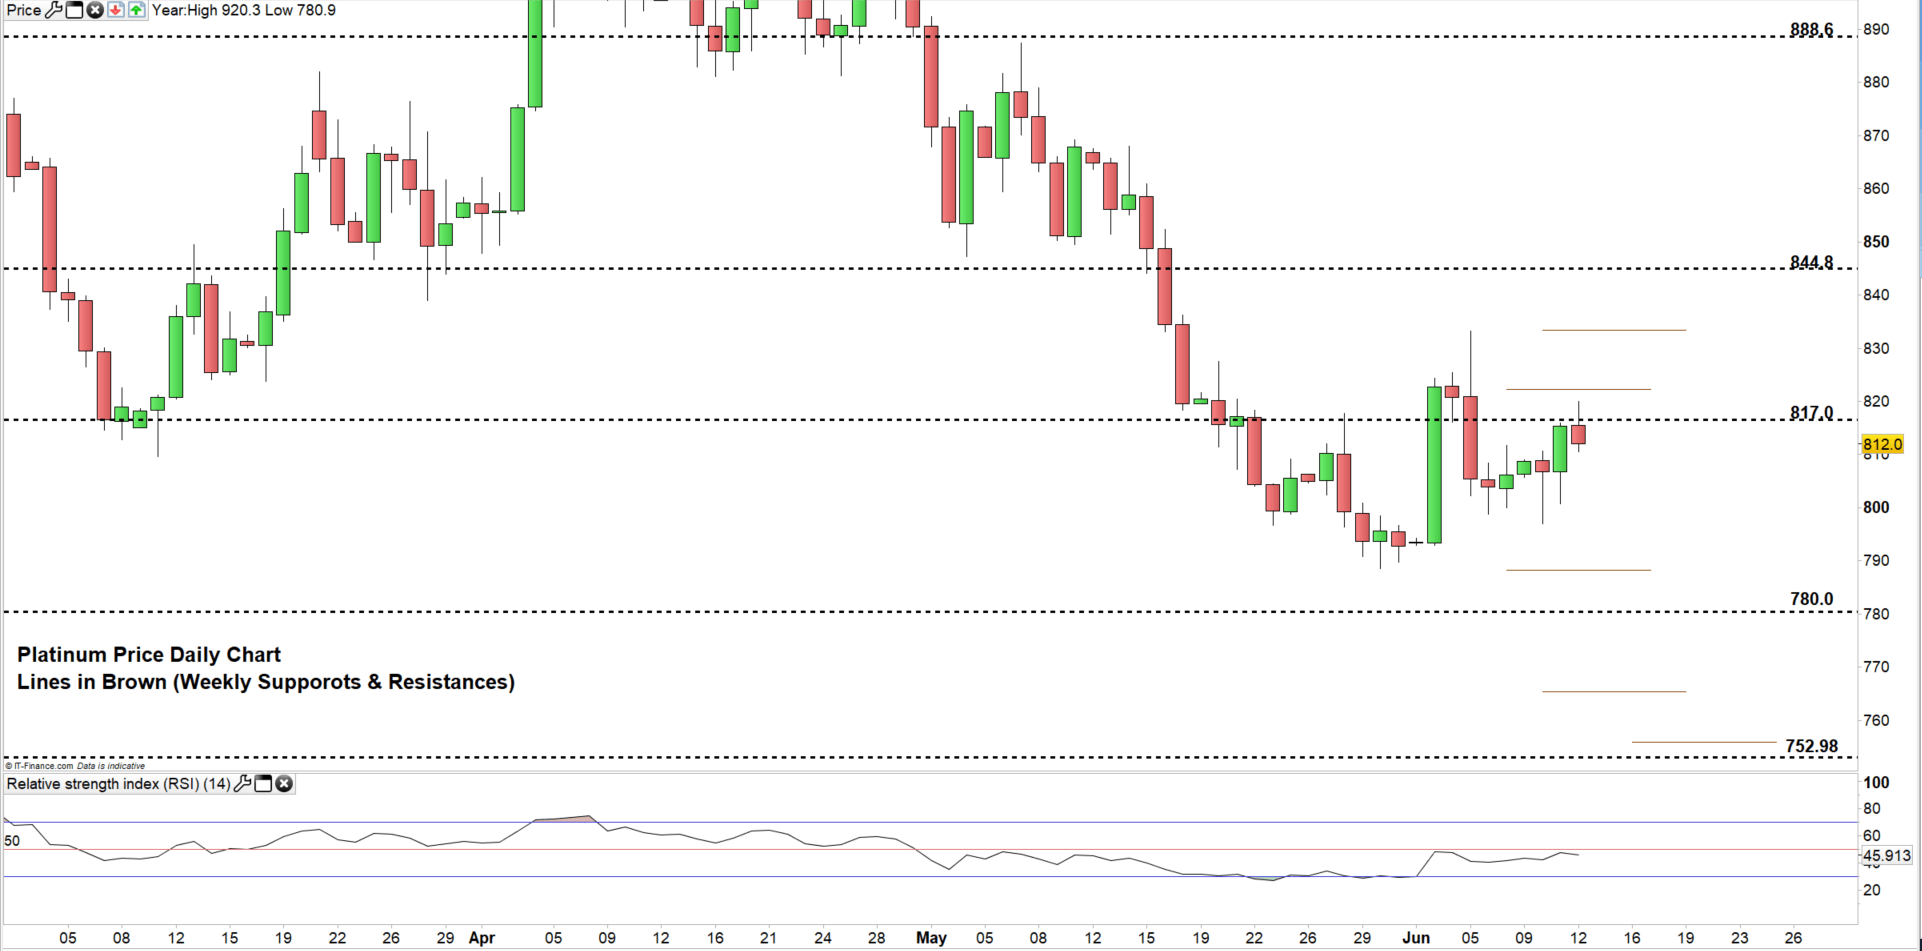
Platinum DAILY PRICE CHART (Mar 1, 2019 – JUn 12, 2019) Zoomed In
Platinum DAILY PRICE CHART (May 11, 2017 – JUn 12, 2019) Zoomed OUT

Looking at the daily chart we notice platinum failed to close lower since Jun 6 creating noticeable wicks and highlighting hesitation from the bears to send the price lower. Therefore, if the price closes above $817.0 it could mean a rally towards $844.8. However, the weekly resistance level at $822.0 and the Jun 5 high at $833.3 need to be watched closely.
On the flipside, a close below the Jun 10 low at $796.9 may lead the price towards $780.0. Although, the support level at the May 30 low at $788.5 is worth monitoring.
Just getting started? See our Beginners’ Guide for FX traders
Platinum Four-HOUR PRICE CHART (May27, 2019- JUN 12, 2019)

Looking at the four- hour chart we notice platinum rallied at the start of the week and carved out yesterday a higher low at $800.7. The price created after noticeable wicks followed with two bearish Doji patterns highlighting weakness in the bullish momentum.
A break below yesterday’s low mentioned above might lead the price towards the weekly low at $788.5. However, the support level at Jun 10 trough (weekly low) should be kept in focus.
In turn, if the bullish momentum resumes then a break above the weekly resistance at $822.0 could send the price higher towards the June 4 peak (the monthly high) at $833.3. The daily resistance at $827.0 need to be considered.
Written By: Mahmoud Alkudsi
Please feel free to contact me on Twitter: @Malkudsi


