


NORDIC FX, NOK, SEK WEEKLY OUTLOOK
- USD/SEK is cooling off – aiming at new support?
- USD/NOK may have entered a new trading range
- Krona, Krone likely to show weakness in 2019
See our free guide to learn how to use economic news in your trading strategy !
USD/SEK TECHNICAL ANALYSIS
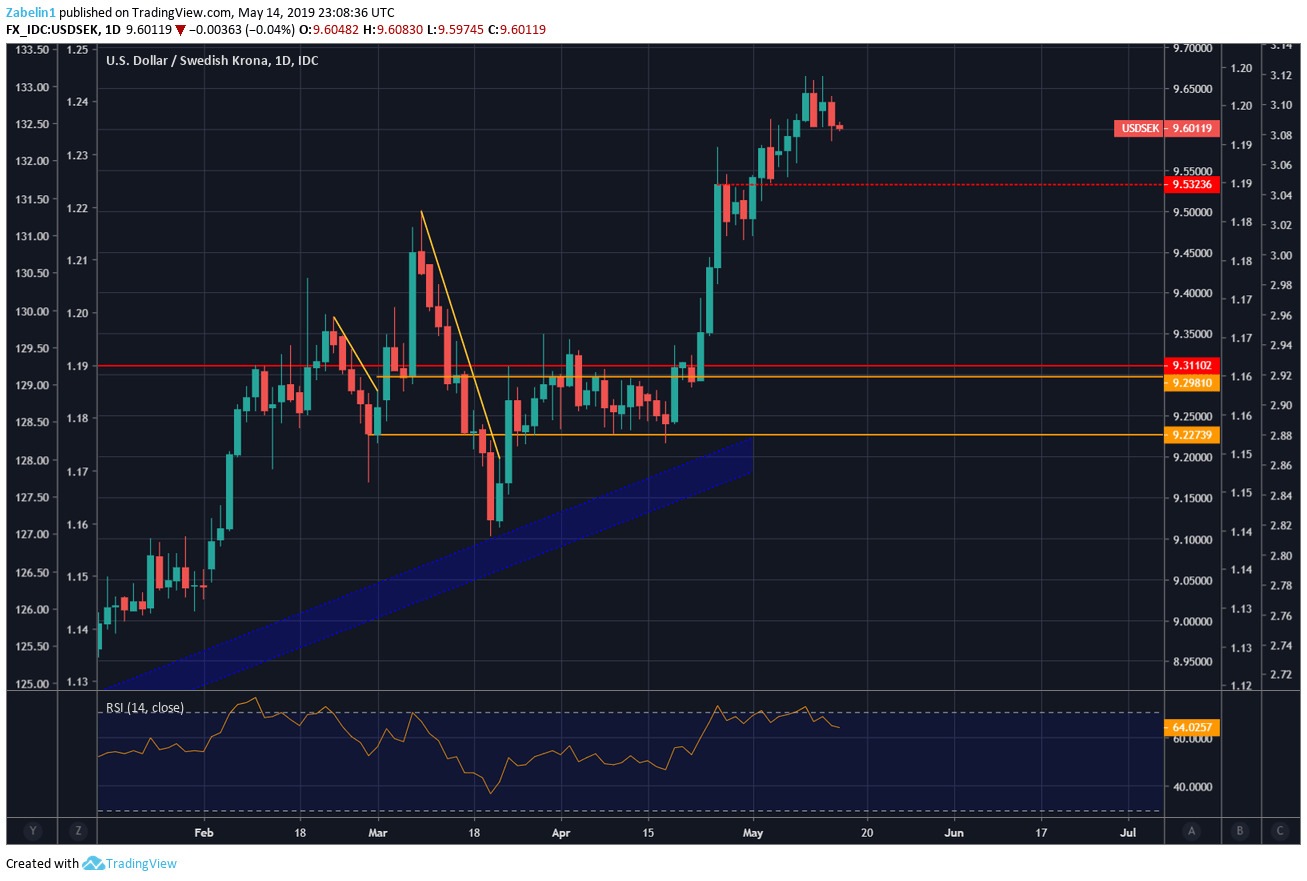
Last week saw USD/SEK’s upward trend continue higher, defying expectations that the pair would cool off and test a new support at 9.5323. Fundamental factors from unexpected escalation of US-China trade wars and local economic data appear to have been the main drivers of the pair’s surge. However, this week USD/SEK may test the resolve of the floor at 9.5323 (red dotted line).
The pair may encounter some soft floors along the way and if the USD/SEK bounces back after touching 9.5323, it could be read as a reinforcement of bullish sentiment. Conversely, a break below with follow through would confirm that the spike was merely a sugar rush.
USD/SEK – Daily Chart
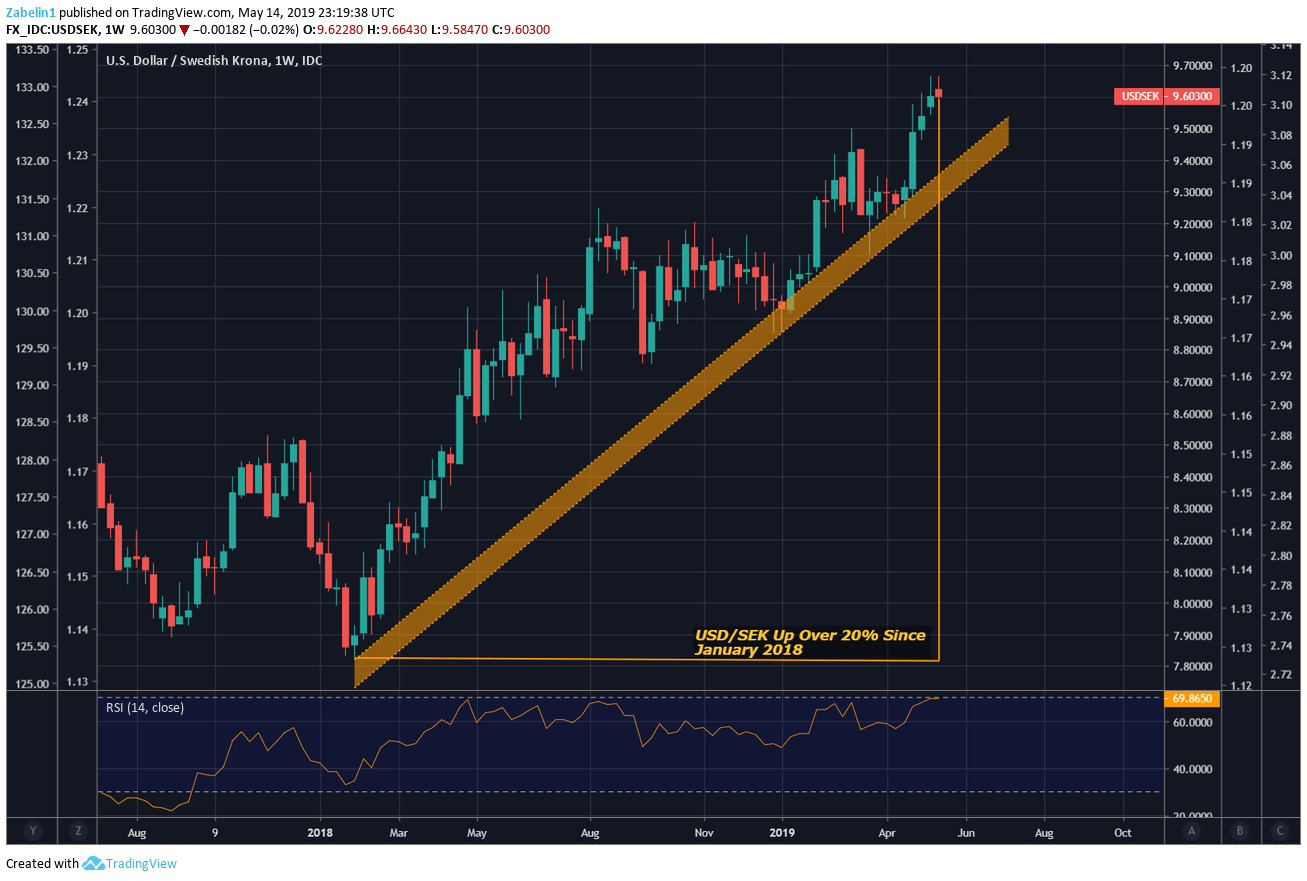
From January 2018 onward, USD/SEK has been marching up rising support (yellow channel) and is looking to continue along this two-year channel. Since the start of 2018, the pair has risen over 20 percent, and the outlook for Swedish monetary policy suggests this steep trend will continue.
USD/SEK – Weekly Chart
USD/NOK TECHNICAL ANALYSIS
On a daily chart, USD/NOK may have formed a new but short-term range between 8.6937-8.7883 (yellow lines). The pair is continuing to climb along the upward-sloping support channel (red parallel lines) and had a sharp rebound after testing the lower lip in mid-April. The recovery suggests that underlying bullish momentum for the pair remains strong.
USD/NOK – Daily Chart

As outlined in last week’s technical forecast, USD/NOK will likely continue to climb along the steep rising support. The bullish outlook for the pair is reinforced on a monthly chart that shows a bullish continuation pattern, combined with fundamental tailwinds that will push pair higher.
USD/NOK – Monthly Chart

SWEDISH KRONA, NORWEGIAN KRONE TRADING RESOURCES
- Join a free Q&A webinar and have your trading questions answered
- Just getting started? See our beginners’ guide for FX traders
- Having trouble with your strategy? Here’s the #1 mistake that traders make
--- Written by Dimitri Zabelin, Jr Currency Analyst for DailyFX.com
To contact Dimitri, use the comments section below or @ZabelinDimitri on Twitter


