


Gold Price, Rupee Technical Highlights:
- Gold price unsupported by Dollar decline, faces headwinds
- USDINR has clean technicals pointing to lower prices
See what intermediate-term fundamental drivers and technical signposts our team of analysts are watching in the DailyFX Q2 Gold Forecast.
Gold price unsupported by Dollar decline, faces headwinds
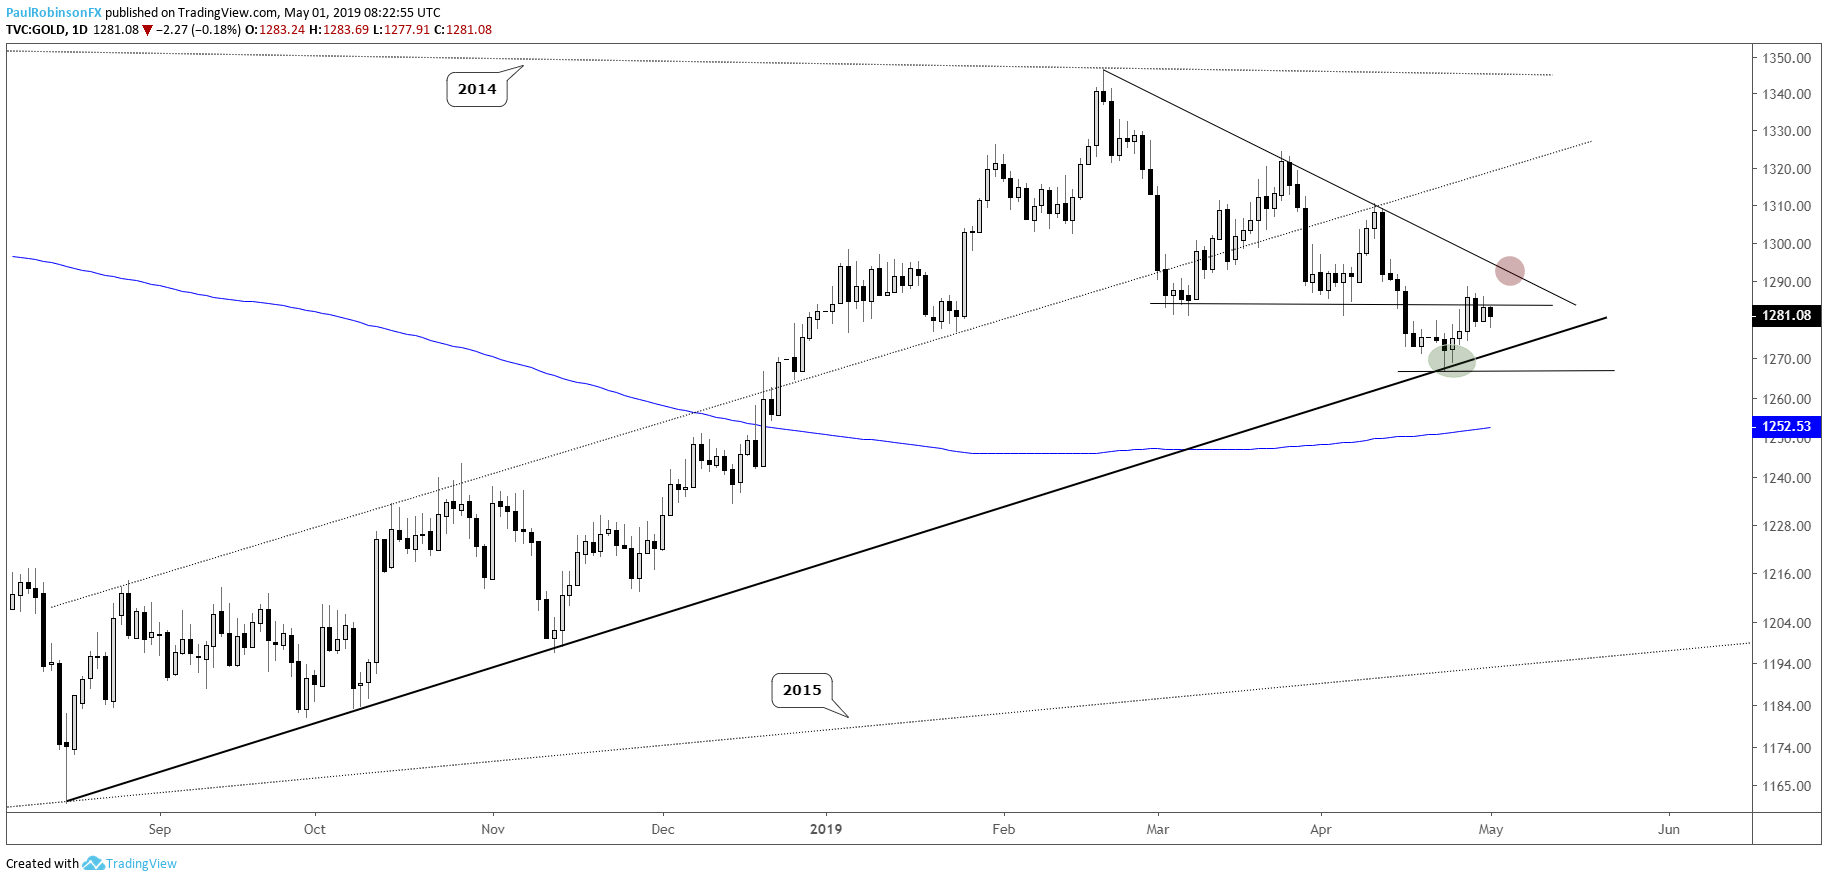
The gold price has undergone a small bounce since touching off on the August trend-line, and while initially it was acting well in the face of a Dollar breakout, that breakout has since faded strongly and gold has done little in the way of find buyers.
This is part of the problem of fixating on the gold, Dollar relationship; in the short-term it can fall apart and come together without warning and can be of limited usefulness. With the US Dollar Index (DXY) failing its recent breakout we may see a sudden tailwind kick in for gold, but looking at gold’s technical posturing in a vacuum it has headwinds.
While the August trend-line is an important source of support still in place, the general trend off the February high is negative with the descending wedge broken on April 16 still intact. It will require that gold rallies beyond the February trend-line before we can consider the downtrend to have possibly changed course and the wedge-break to have been invalidated.
Tactically speaking, with gold caught between solid support and a weak trend structure, both sides of the ledger are in limbo here. A hard break of either aforementioned technical threshold (August or Feb trend-line) is needed to give one side or the other the upper hand. The descending wedge-break suggests an eventual break of the August trend-line will unfold. We shall see...
Check out the IG Client Sentiment page to see how changes in trader positioning can help signal the next price move in gold and other major markets and currencies.
Gold Daily Chart (caught in the middle)
USDINR has clean technicals pointing to lower prices
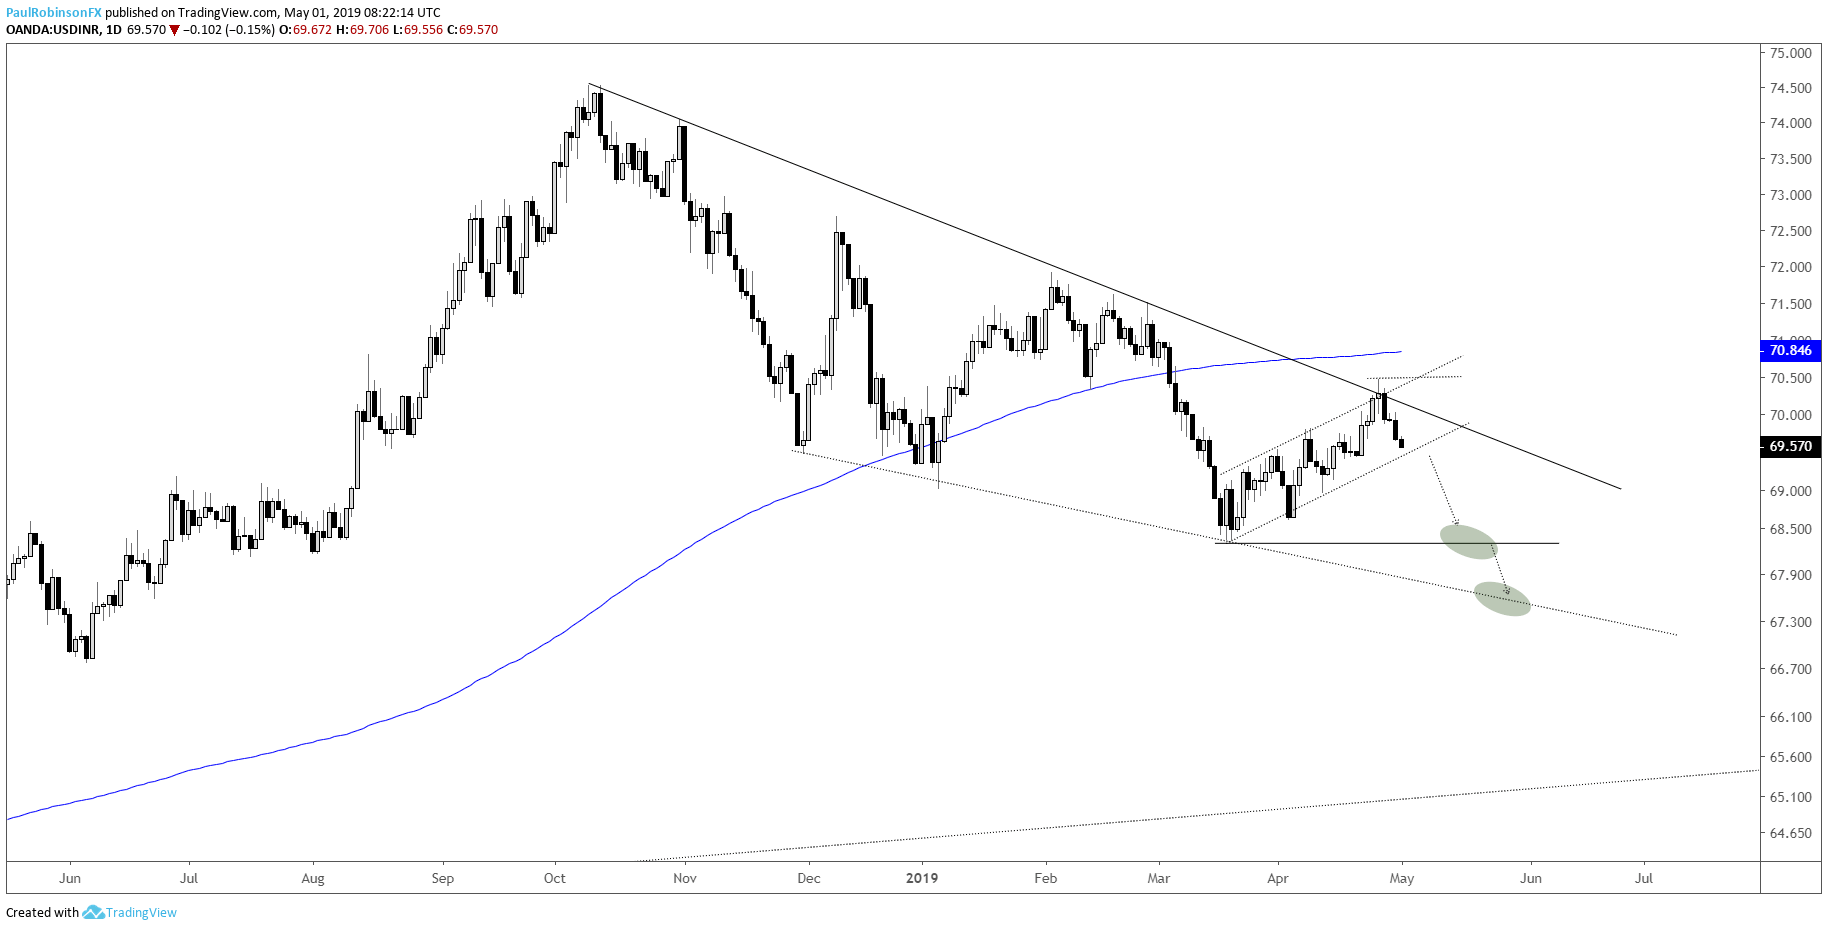
The trend for USDINR since October has been down with decisiveness, and with the current technical set-up that looks set to continue. Last week, a reversal took shape off the trend-line since last year’s high, further developing a bear-flag.
A breakdown looks set to lead USDINR towards the March low at 6834, with the next objective below there targeted at the underside trend-line extending over since December, in the 6700s. It will require a break above the trend-line and recent high at 7044 to turn things neutral to bullish.
USDINR Daily Chart (t-line, bear-flag point to lower prices)
Resources for Forex & CFD Traders
Whether you are a new or experienced trader, we have several resources available to help you; indicator for tracking trader sentiment, quarterly trading forecasts, analytical and educational webinars held daily, trading guides to help you improve trading performance, and one specifically for those who are new to forex.
---Written by Paul Robinson, Market Analyst
You can follow Paul on Twitter at @PaulRobinsonFX


