


AUDUSD/USDCAD Chart Highlights:
To see what fundamental drivers and technical signposts DailyFX analysts are watching, check out the Q2 forecasts for various markets on the DailyFX Trading Guides page.
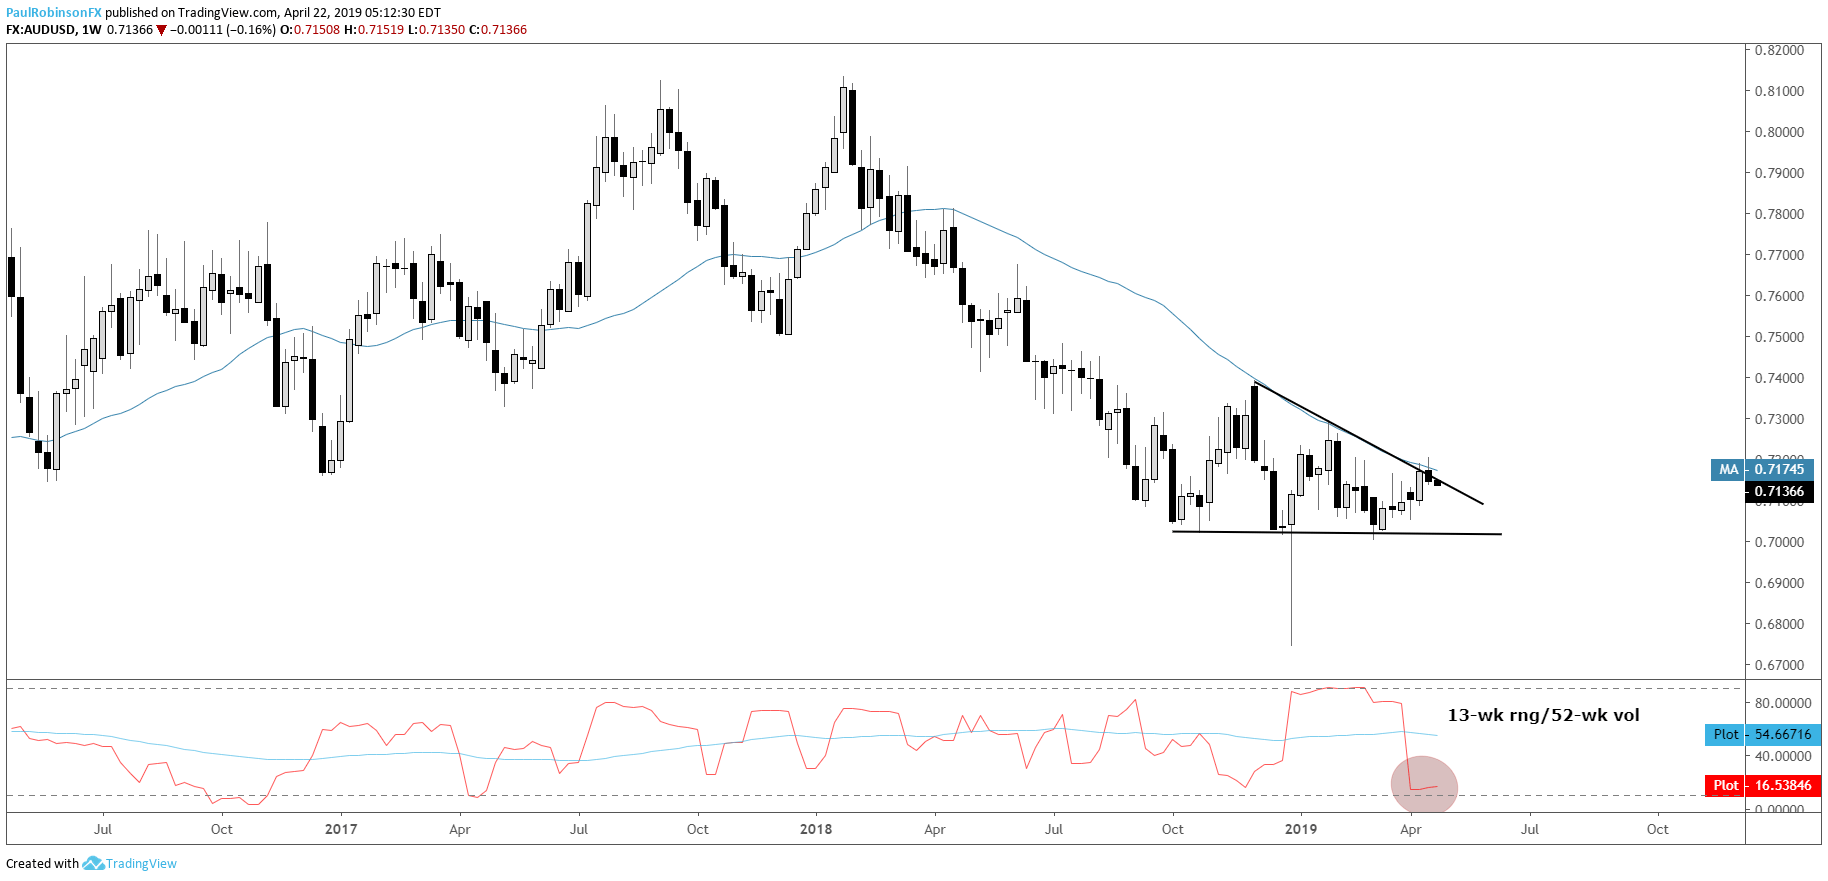
AUDUSD channel inside weekly triangle
AUDUSD has been a real grind along with most of the major FX world. The size of the 3-month range when adjusted for 52-week volatility is in the bottom 16% when looking back over the past five years. While small, it can get smaller with some room to go before the apex of a developing wedge is met.
The descending wedge on the weekly chart (excluding the flash-crash low) is in-line with the broader trend lower since the beginning of last year, suggesting we are more likely to see a downside break. Cracking the 7000-mark will be the key for Aussie to really start rolling downhill again.
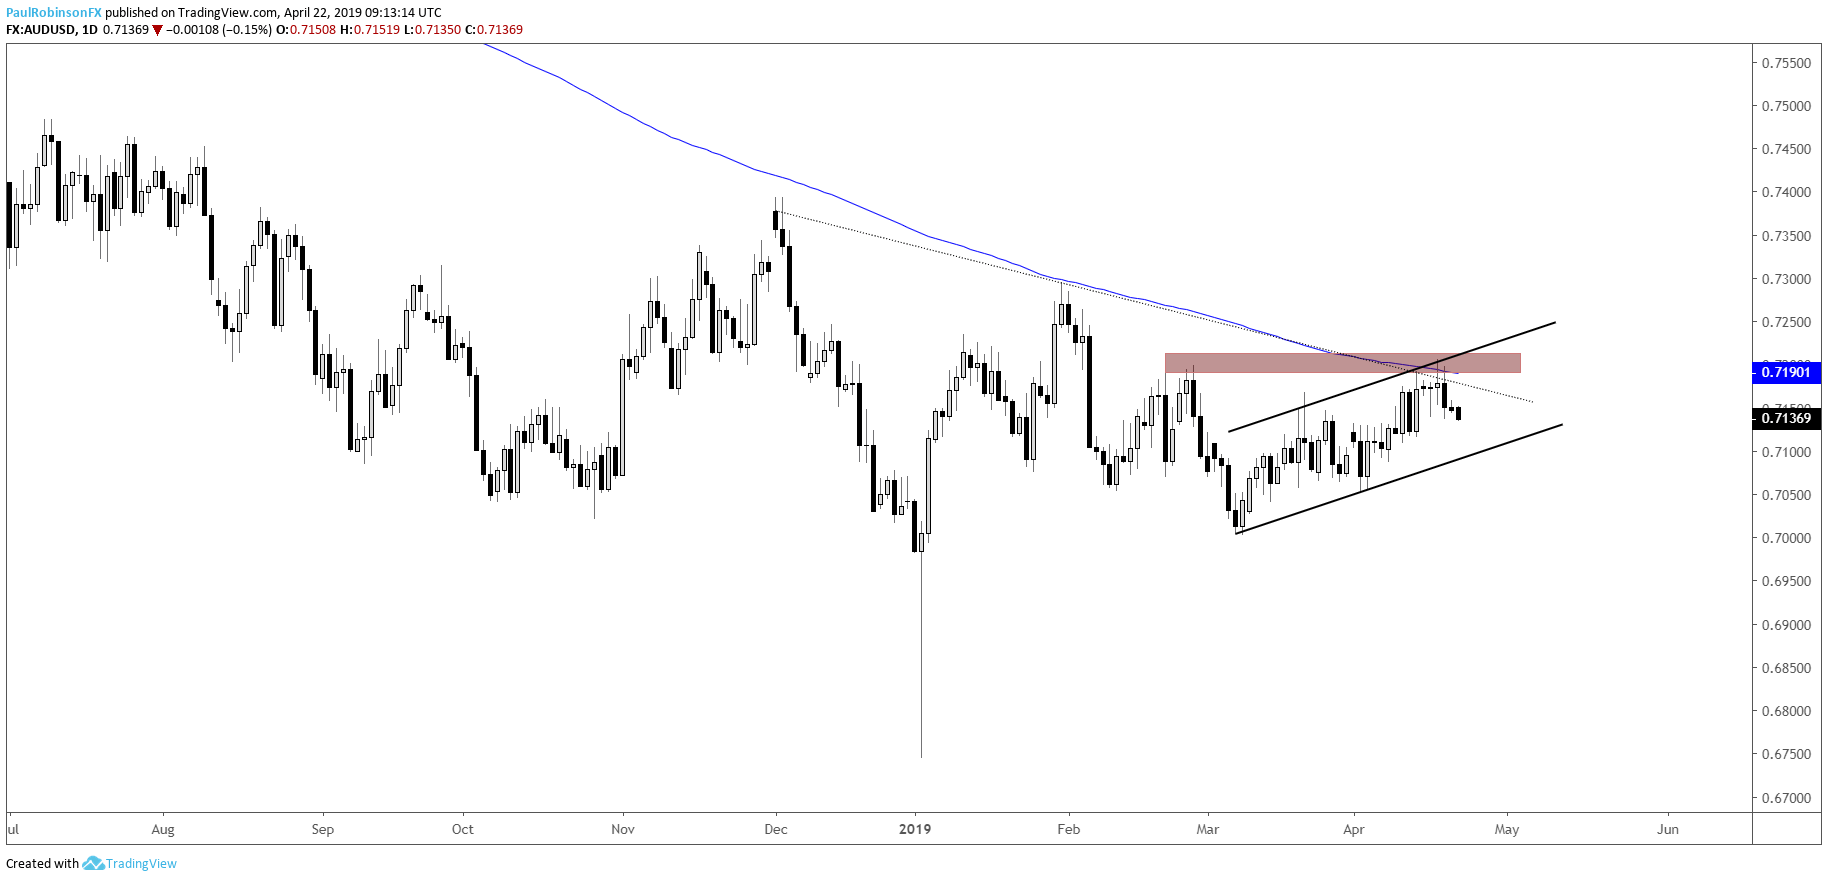
Shorter-term, there is a channel developing within the wedge. This structure can be used as a guide for fades on the top and bottom-side for as long as it holds. The bottom-side parallel is anticipated to give-way at some point fairly soon, though.
AUDUSD Weekly Chart (Descending wedge forming)
AUDUSD Daily Chart (Trading inside channel)
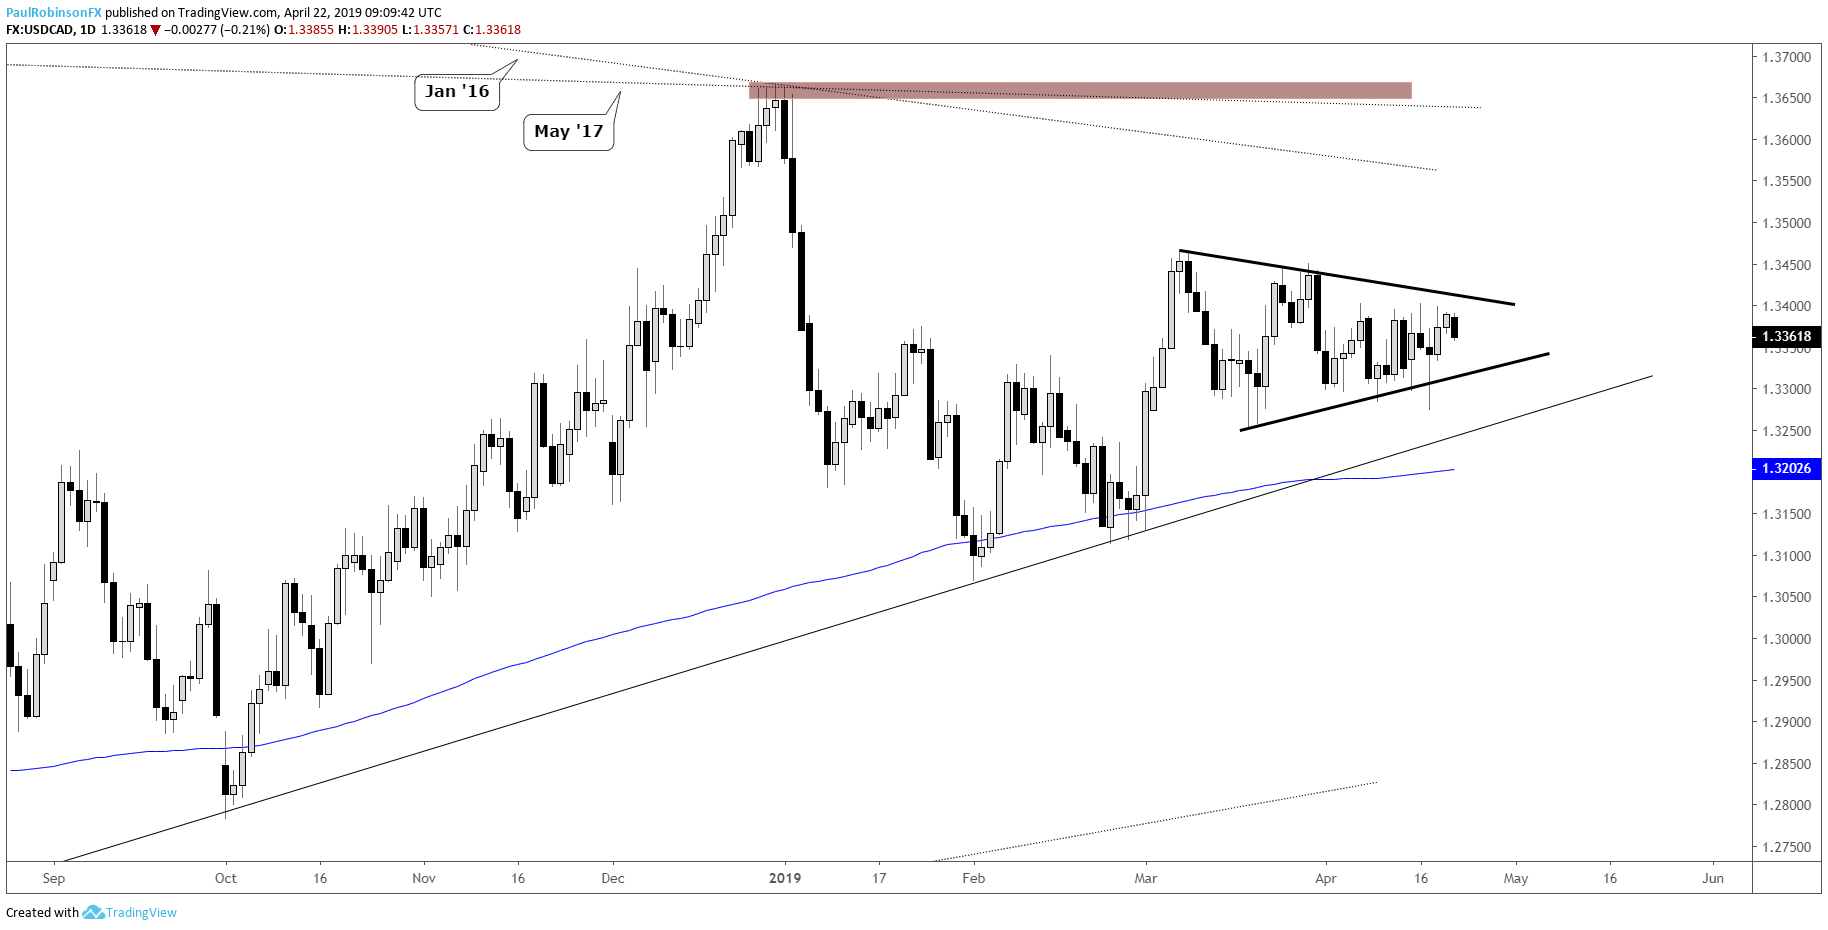
USDCAD forming a triangle within upward channel
Choppy trading in USDCAD has created the narrowest 3-month range (adjusted to 52-week vol) since October. We are also seeing this range tighten on the daily time-frame into a triangle formation. Giving the benefit of the doubt to the upward slope of the channel in place since September 2017, an upside break is anticipated not too long from now. A breakout should have the 13600s in play relatively quickly. To turn USDCAD negative, broadly speaking, a breakdown out of the channel and below the yearly low at 13068 will be needed.
USDCAD Weekly Chart (narrow range within upward channel)

USDCAD Daily Chart (triangle forming)
Forex & CFD Trader Resources
Whether you are a new or experienced trader, we have several resources available to help you; indicator for tracking trader sentiment, quarterly trading forecasts, analytical and educational webinars held daily, trading guides to help you improve trading performance, and one specifically for those who are new to forex.
---Written by Paul Robinson, Market Analyst
You can follow Paul on Twitter at @PaulRobinsonFX


