


Technical Highlights:
- Dow Jones long-term topping pattern becoming visible
- Gold remains stuck in a giant wedge, risk to downside
- Crude oil rally may turn into another sell-off soon
- US Dollar Index (DXY) building an ascending wedge
Check out the intermediate-term market forecasts and educational content on the Trading Guides page.
Dow Jones long-term topping pattern becoming visible
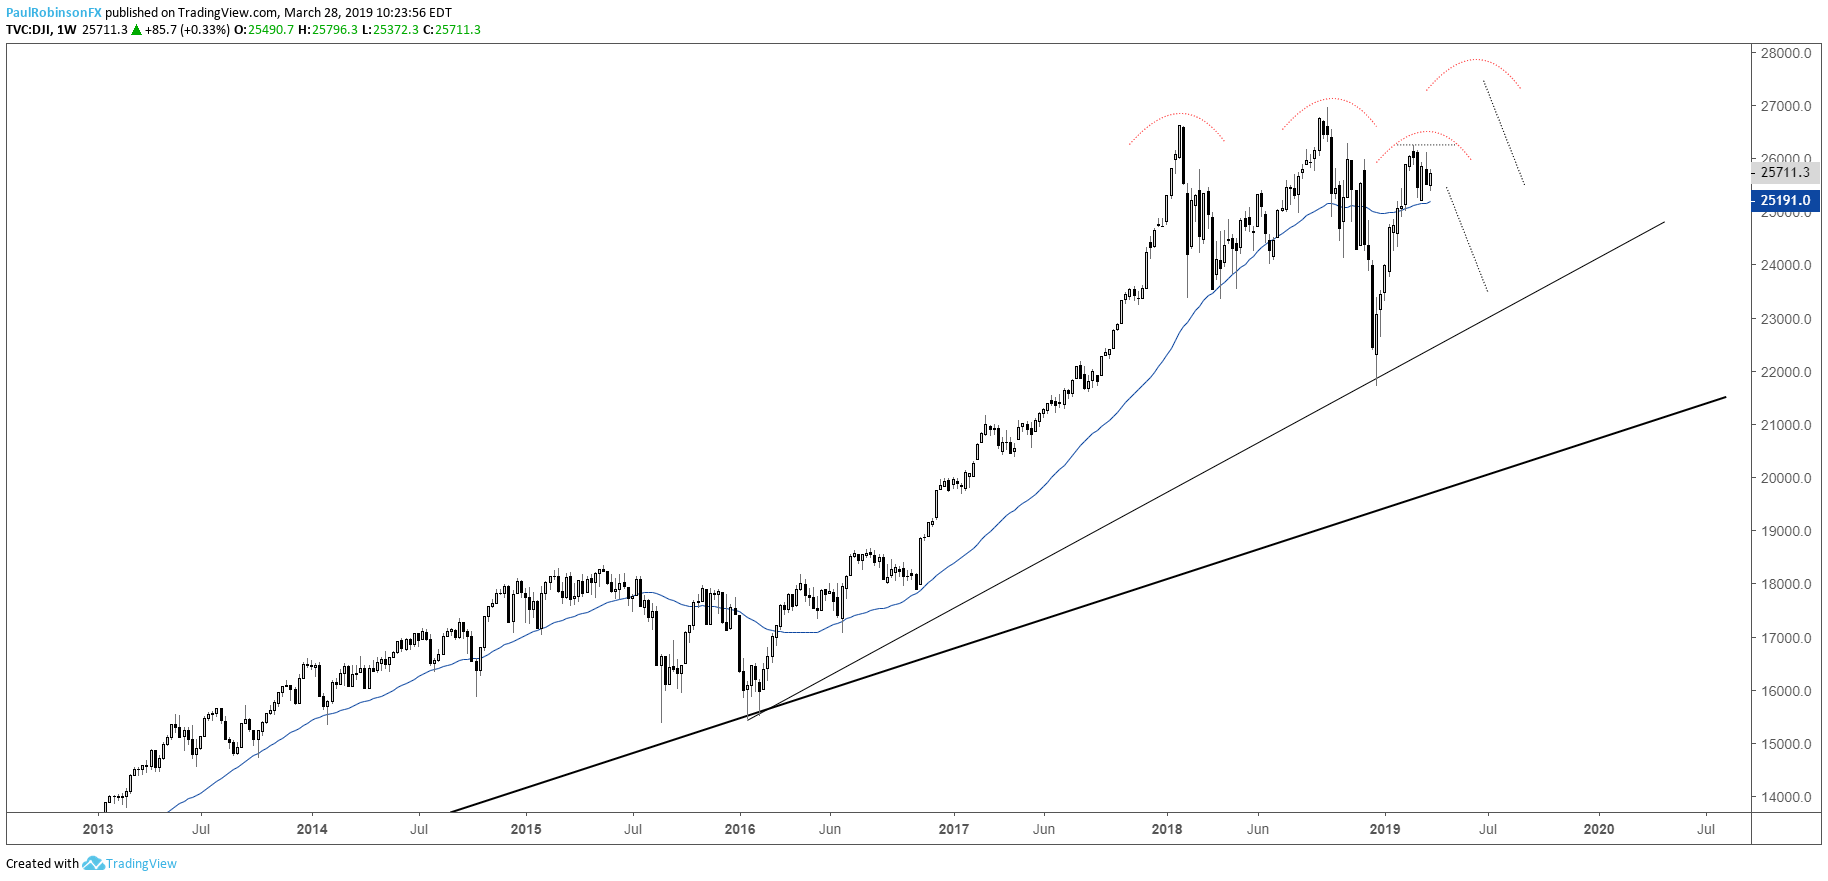
The U.S. stock market has been gyrating since early last year and with these moves a macro topping pattern is coming into view, which depending on how things play out in the relatively near future could shake out as one of a few different configurations.
The first is a simple head-and-shoulders top. If this is to be the case, then the market should start to roll over here very soon towards the 2016 trend-line. Knit-picking, we could call it a double-top with a lower-high, with the possibility of being a triple top on another failure at or near the record high. In any event, they all have similar looks to them and the same outcome.
The alternative to the sequence is for a new record high to develop, creating a Reverse Symmetrical Triangle (RST) formation. This pattern forms by increasingly larger swings with new highs and new lows, indicating growing instability in the market. This would mean any new record high notched wouldn’t hold for long before a strong sell-off would take hold.
All-in-all, it looks like we are amidst a time that may mark the beginning of another major upheaval in stocks.
Dow Jones Weekly Chart (Top developing?)
With global stocks having rebounded, see where our analysts see stocks headed in the Q2 Global Equities Forecast.
Gold remains stuck in a giant wedge, risk to downside
Gold has been building a wedge for years as volatility has dried up. The compression, though, won’t last forever and it is likely a big move will commence sometime in the next 6-12 months. But in the interim, another move lower is looking like the next path for gold to continue filling out the massive pattern. This could take gold down to the 1225-area in the coming weeks/months.
Gold Weekly Chart (Big-picture wedge continues to shape)

To see the intermediate-term fundamental and technical outlook for Bullion, check out the Q2 Gold Forecast.
Crude oil rally may turn into another sell-off soon
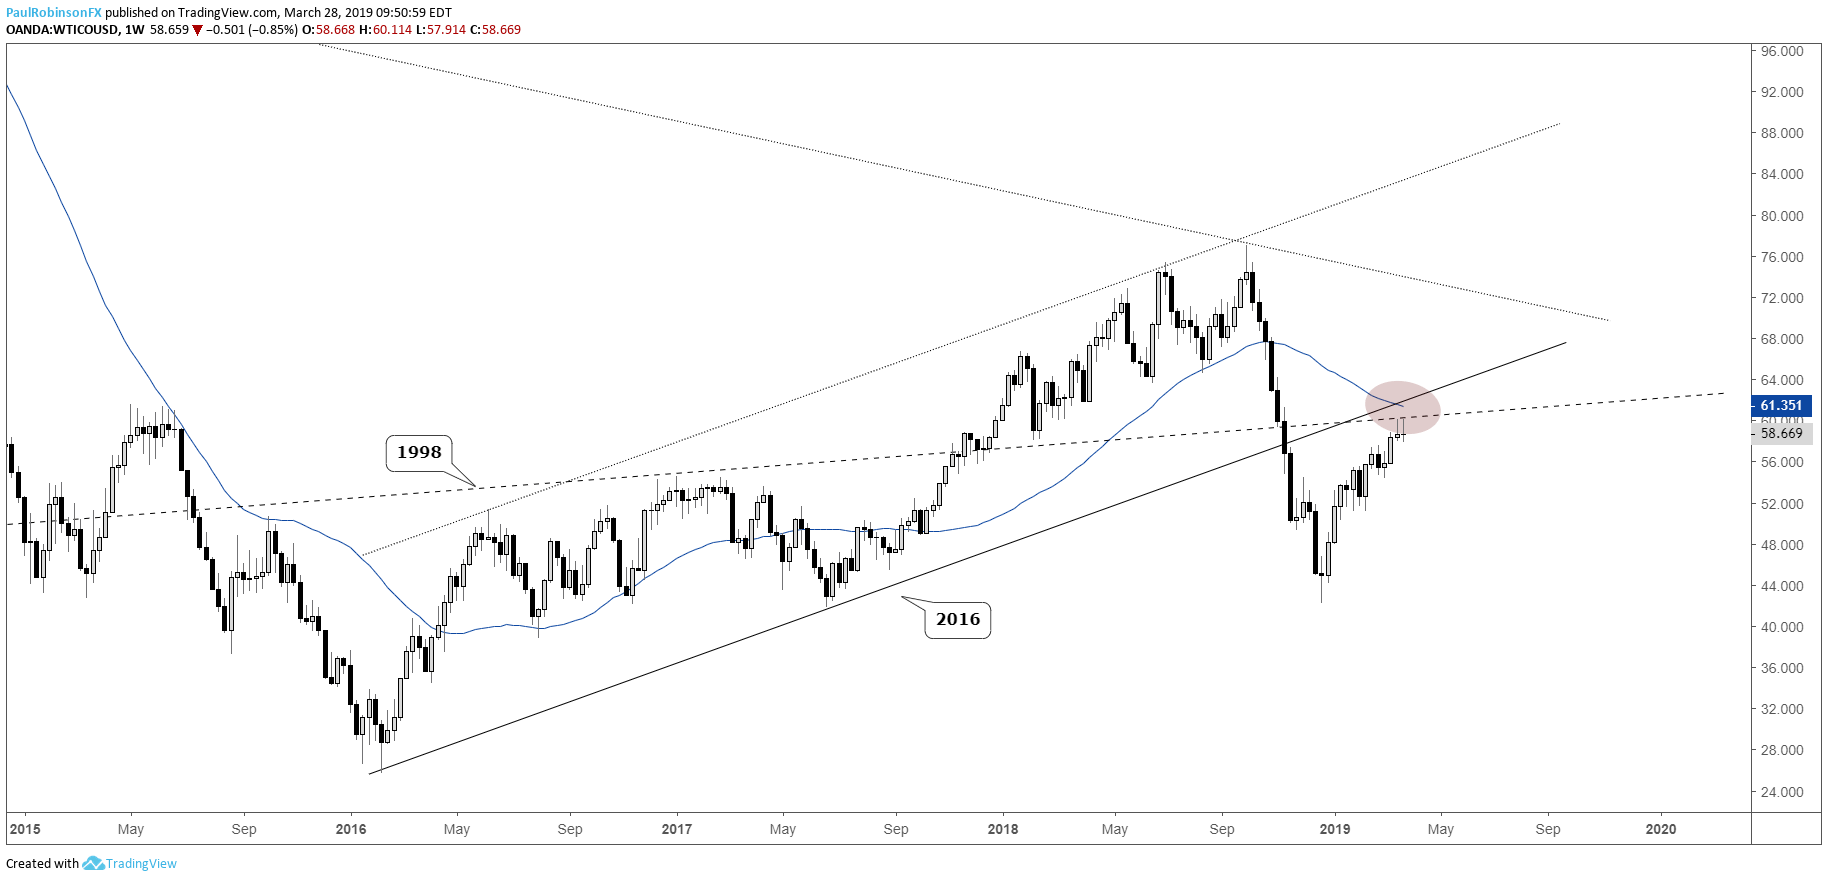
The bounce in oil may be just about finished as a major confluence of levels/lines are coming into play. The underside of the 2016 trend-line, 1998 slope, and 200-day are all converging in the same vicinity. For you ‘Fib fans’ oil is trading right around the 50% mark of the down-move off the 2018 high.
If stocks weaken too, this could spell trouble again as it did at the end of last year as stocks, oil, and the economy (?) take a hit. At the least oil looks like its advance will be put on pause in the weeks ahead.
Crude Oil Weekly Chart (Confluence of lines)
See what drivers and technical factors are expected to move oil in the coming months in the Q2 Crude Oil Forecast.
US Dollar Index (DXY) building an ascending wedge
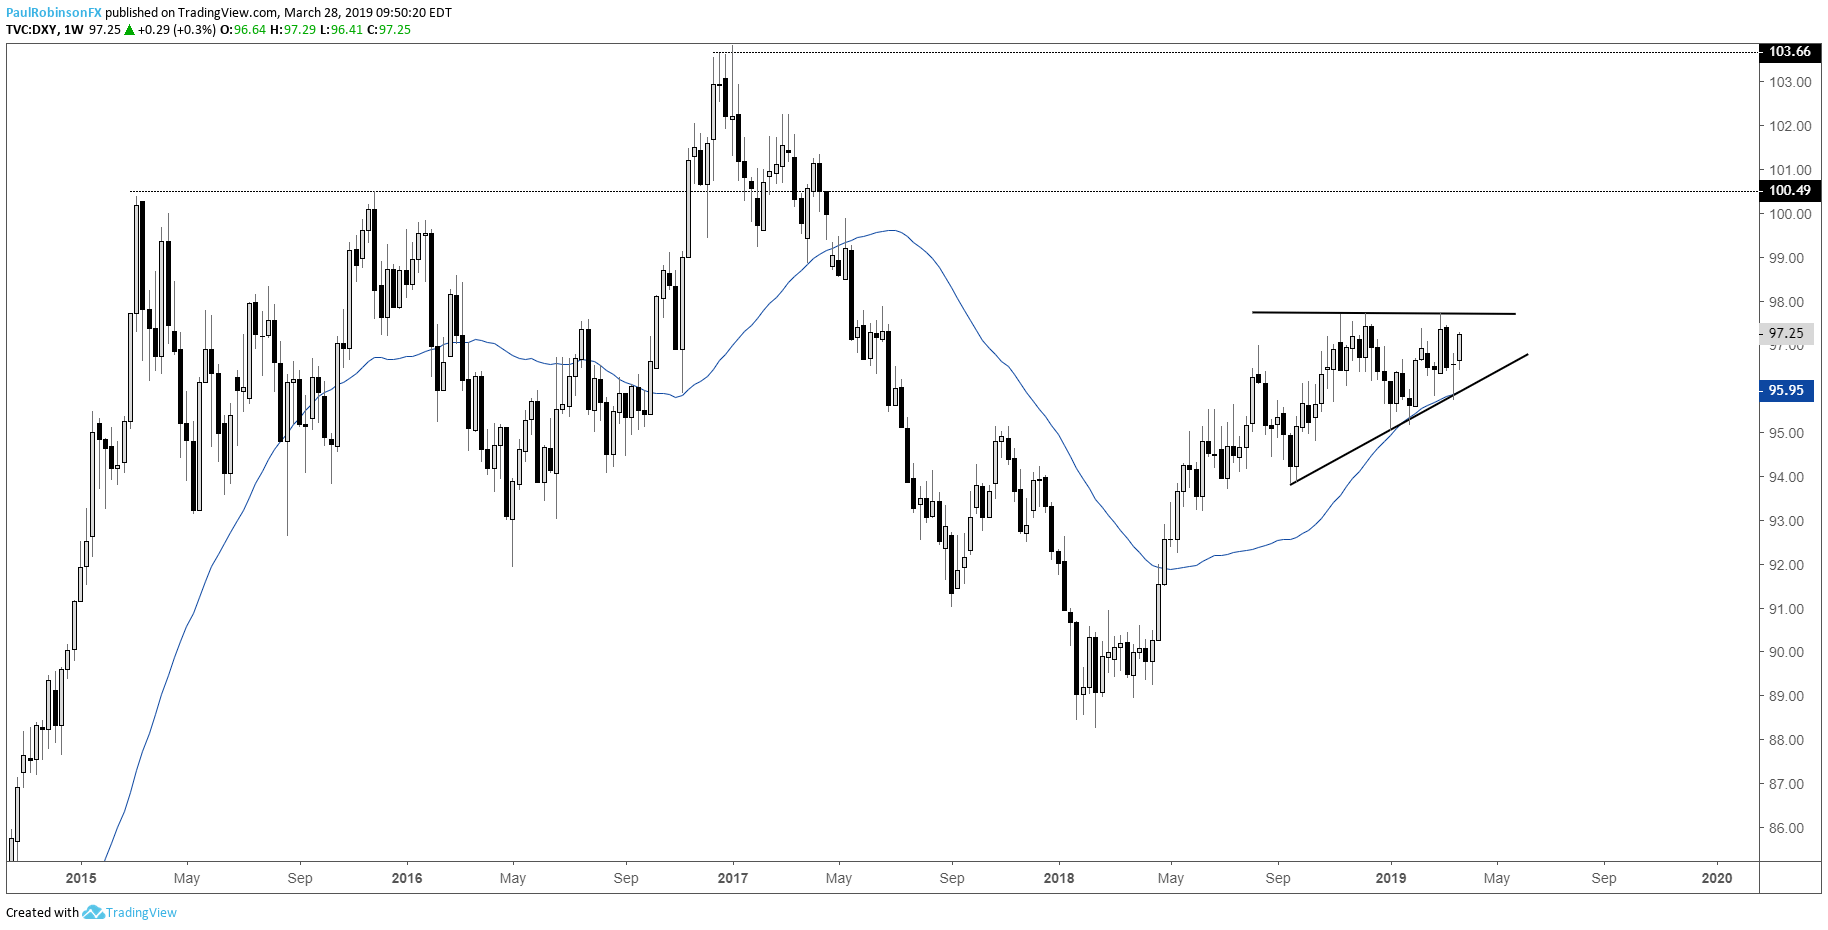
This is becoming a pretty clear ascending wedge here in the DXY index, suggesting the Dollar is likely to rally soon towards the 100-mark or better. The pattern still has a little room to reach the apex, but a breakout could happen at any time.
A strong push through the top of the pattern at 97.71 should get currencies rolling downhill (namely the Euro) versus the Dollar. In the event of the lesser-likely breakdown scenario, the bias will turn somewhat bearish with the risk of a broader range pattern developing down to around levels formed back in the fall.
US Dollar Index (DXY) Weekly Chart (Ascending wedge building)
The US Dollar didn’t move much during the last quarter of 2018, check out what could make that change in Q2 USD Forecast.
Tools for Forex & CFD Traders
Whether you are a beginning or experienced trader, DailyFX has several resources available to help you; indicator for tracking trader sentiment, quarterly trading forecasts, analytical and educational webinars held daily, trading guides to help you improve trading performance, and one specifically for those who are new to forex.
---Written by Paul Robinson, Market Analyst
You can follow Paul on Twitter at @PaulRobinsonFX


