


Naturally, oil is a key factor in global growth and is acutely sensitive to oversupply given the homogeneity of crude. When global risk markets topped in early October, few saw what was on the horizon before 2018’s end. October brought 2018’s second risk of heart-attack (with first one in February that aggressively brought down risky assets). On October 3, crude traded at a 4-year high of $76.81/bbl, but near the end of December, the market had fallen to the mid-$40/bbl level.
Oil Price Chart: Monthly Timeframe (May 2013 to December 2018)
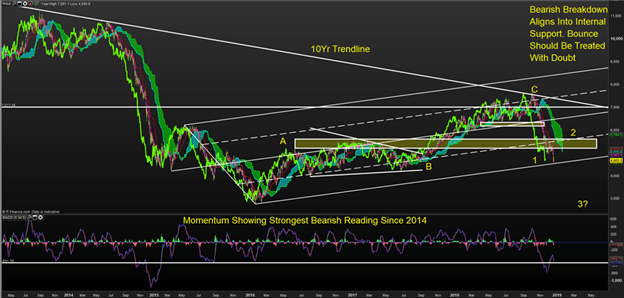
Chart Created by Tyler Yell, CMT
The chart above begins in H1 2014 before the last oil crash with Ichimoku and Andrew’s Pitchfork applied. Ichimoku is a wonderful trend following indicator that is known for the cloud that acts as support in an uptrend and resistance in a downtrend. Naturally, we’re currently focusing on the latter.
Technically, only a break above the cloud that stretches from $53-$60 would shift the view from neutral at best or bearish at worst in a similar vein of 2014 to neutral. Until then, the focus remains sideways or down.
Lastly, the labels (a-b-c and 1-2-3) align with Elliott Wave analysis. Specifically, the view above notes that the 2016-2018 move may have simply been a countertrend rally and that we’re now starting an impulsive decline similar to 2014.
--- Written by Tyler Yell, CMT, Forex Trading Instructor


