


Technical Highlights:
- U.S. Dollar about to finally have an explosive breakout
- Gold to be impacted by USD, risk-on/off; long-term wedge forming?
- Crude oil bounce, then could be headed for the 20s
- S&P 500 has in play test of ‘the’ bull market trend-line
Fresh quarterly forecasts are out, check out the Trading Guides page for these and other resources to help you get off to a good start to 2019!
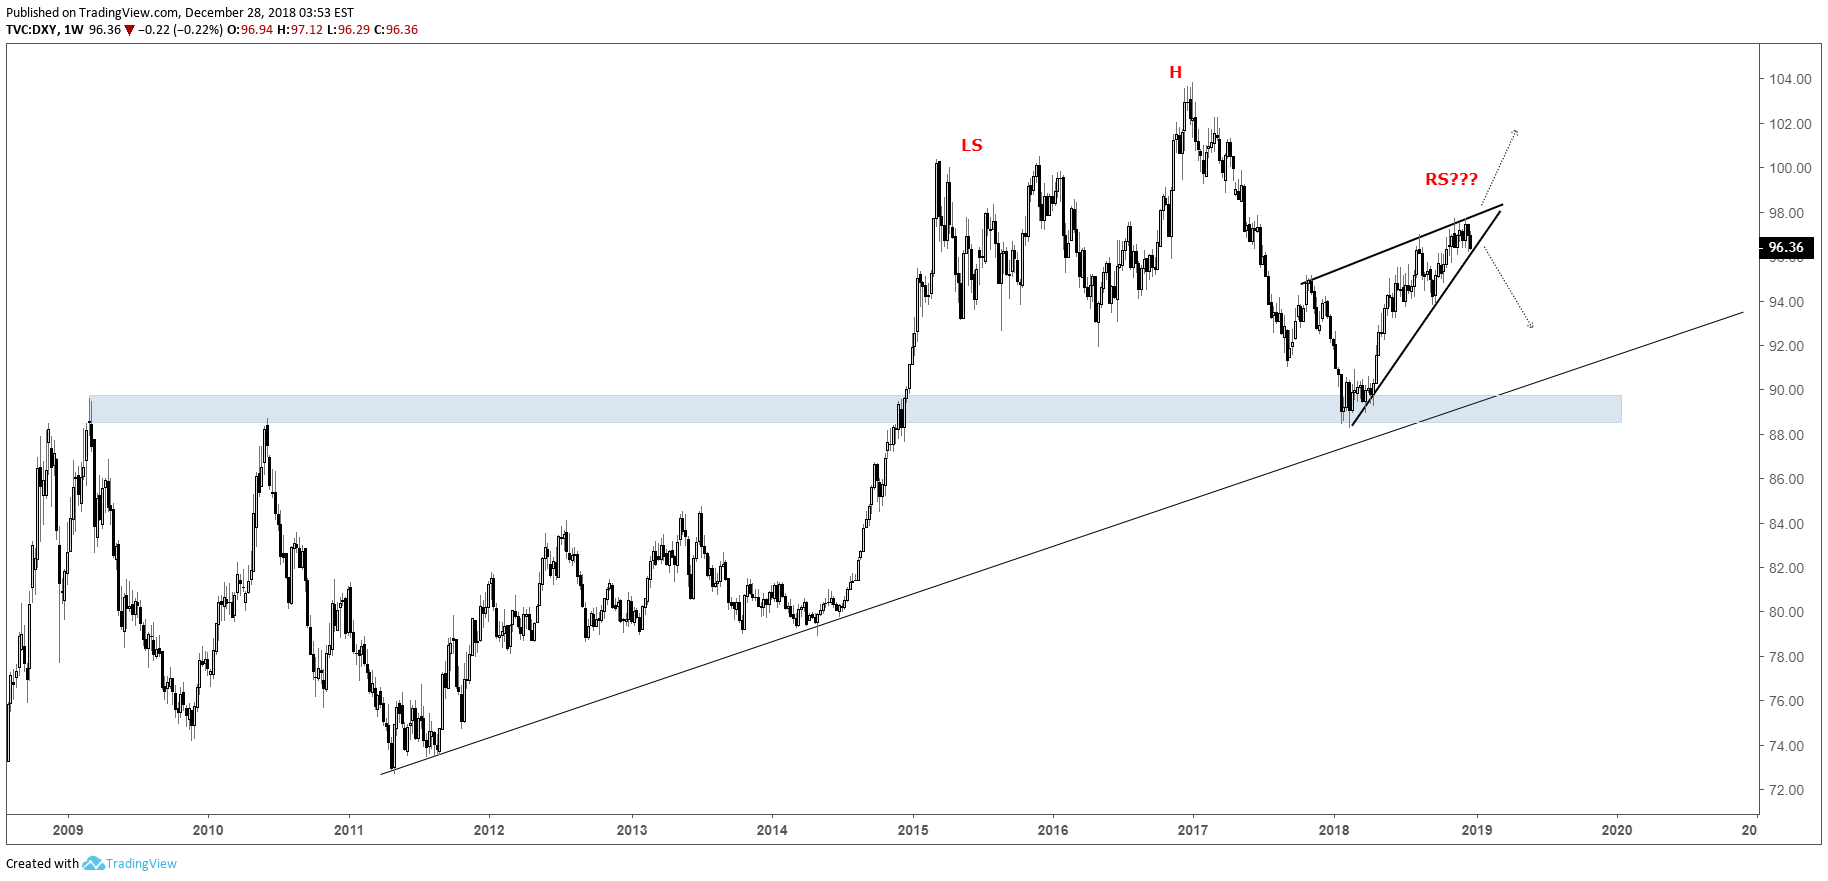
U.S. Dollar about to finally have an explosive breakout
The U.S. Dollar spent all last quarter chewing up traders who tried to bet on it aggressively in either direction. That is set to change as USD becomes bottled up towards a make or break point. It’s not a textbook wedge, but nevertheless since late last year price swings have become increasingly smaller, which typically proceeds a major breakout. Throw in the fact that we’ve seen some major upheaval in global stocks and oil, something macro is brewing and the Dollar is highly unlikely to stand idle for much longer.
A break higher could have the DXY running towards the Jan ’17 high near 104, while a breakdown below the trend-line from April is seen as setting into motion weakness and possibly the right shoulder of a massive head-and-shoulders top under construction since 2015. The H&S is only a scenario given the Dollar needs to shed over 10% for a technical break of the neckline. But nevertheless, a move lower out of the contracting pattern should have the Dollar dropping to at least the September low under 94 and likely even lower to the t-line from 2011.
Awaiting a break either way – look for it to happen soon…
US Dollar Index (DXY) Weekly Chart
US Dollar Index (DXY) Daily Chart

The US Dollar didn’t move much during the last quarter of 2018, check out what could make that change in the Q1 USD Forecast.
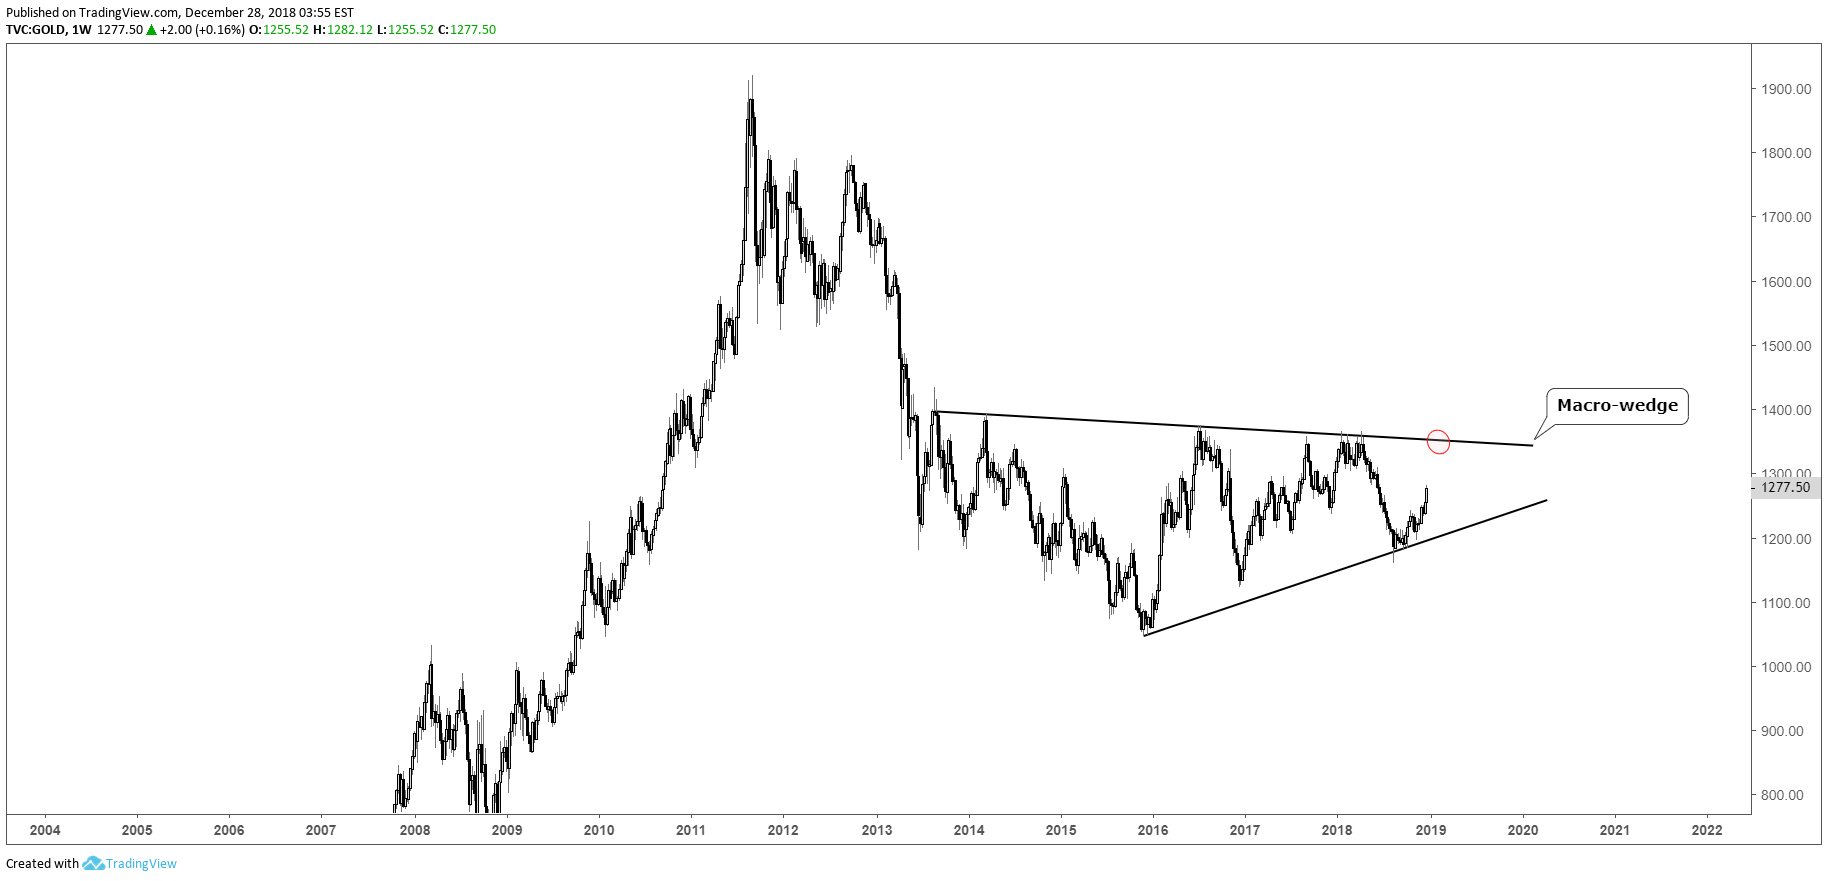
Gold to be impacted by USD, risk-on/off; long-term wedge forming?
Gold has a couple of forces to contend with, the Dollar and a very weak backdrop in risk (stocks). Since bottoming in August gold has become increasingly stronger and if the Dollar drops out of its contracting pattern look for it to accelerate. Weak stock markets will only add icing to the cake for gold longs.
A rally from here will have a very broad wedging formation coming further into view, with an eye on it either acting as a bottoming pattern or a long rest before resuming its trend lower from the 2011 high. For now, a move to top-side trend-line of the pattern may well be in the works, or about another $75 from the current price.
Gold Weekly Chart (Long-term wedge forming)
To see the intermediate-term fundamental and technical outlook for Bullion, check out the Q1 Gold Forecast.
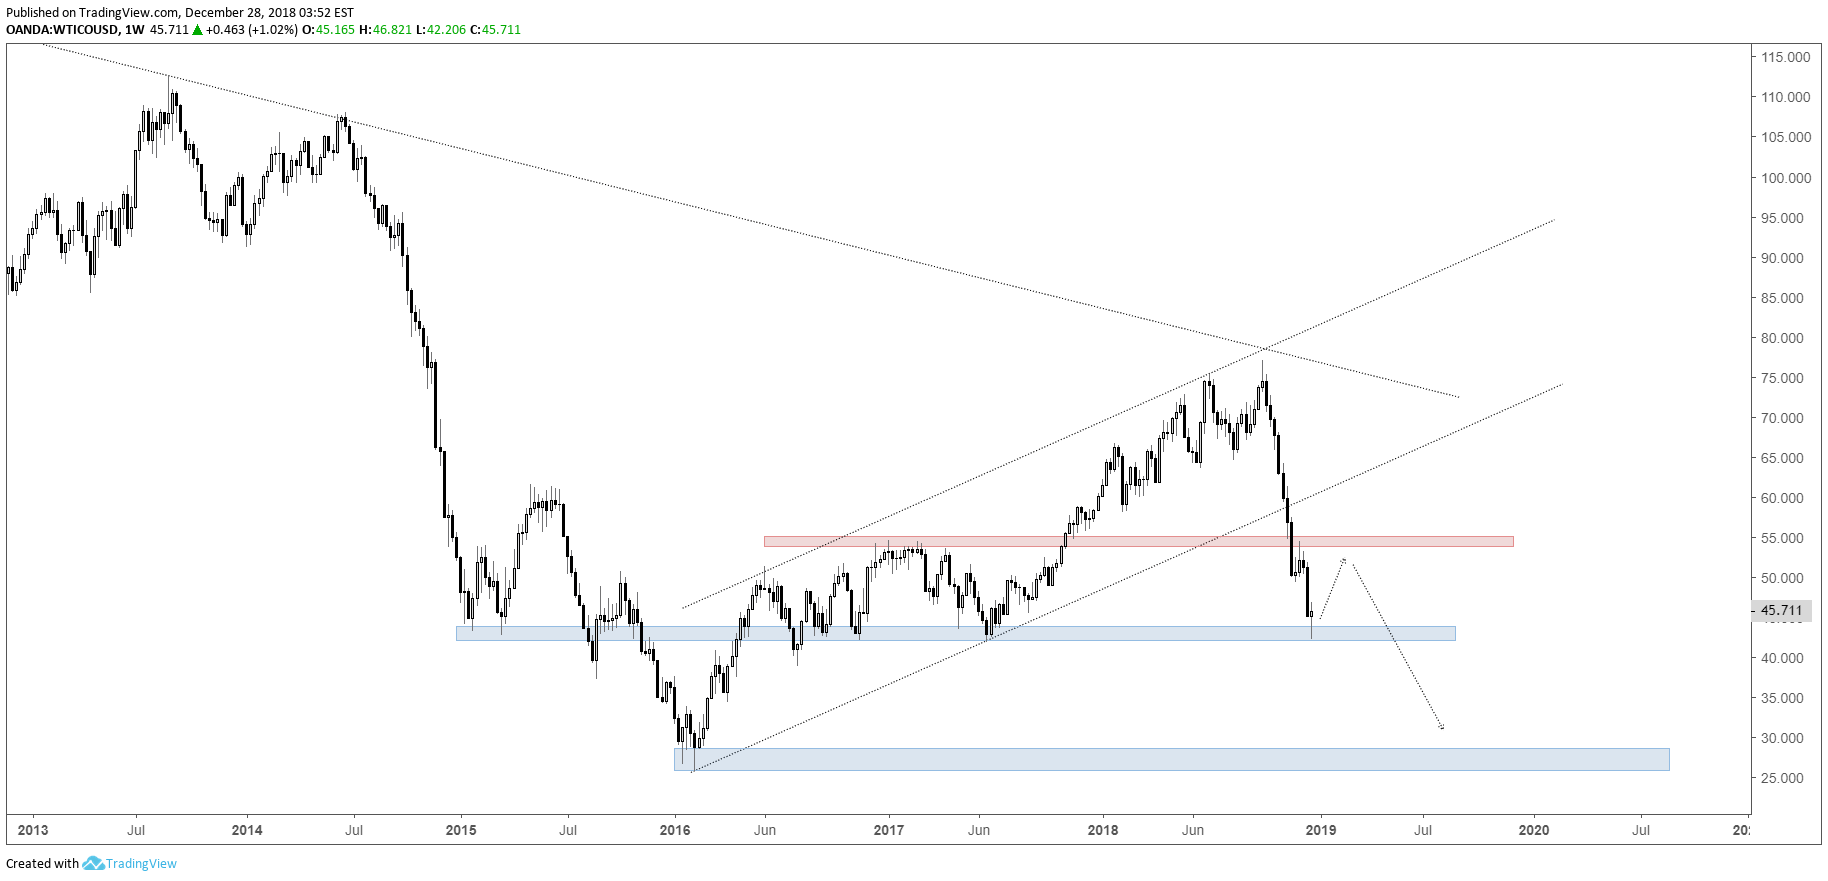
Crude oil bounce, then may be headed for the 20s
The precipitous decline in oil pushed it all the way down to strong support around the 44/42-area. This should hold as oversold conditions have become severe, especially if the S&P 500 too can rally, then we should see both stocks and oil recover for a little while.
A bounce could take oil up as high as 53-55 before running into problems. As is the case with stocks, a rally in oil will be viewed as an opportunity to sell. The expectation is for a rout in global stock markets in 2019, and with it oil could very well find itself traversing levels seen at the lows in early 2016.
Crude Oil Weekly Chart (Bounce, then 20s?)
The sharp drop in oil last quarter is almost certain to keep volatility high in the months ahead, read up on what our analysts are expecting in the Q1 Crude Oil Forecast.
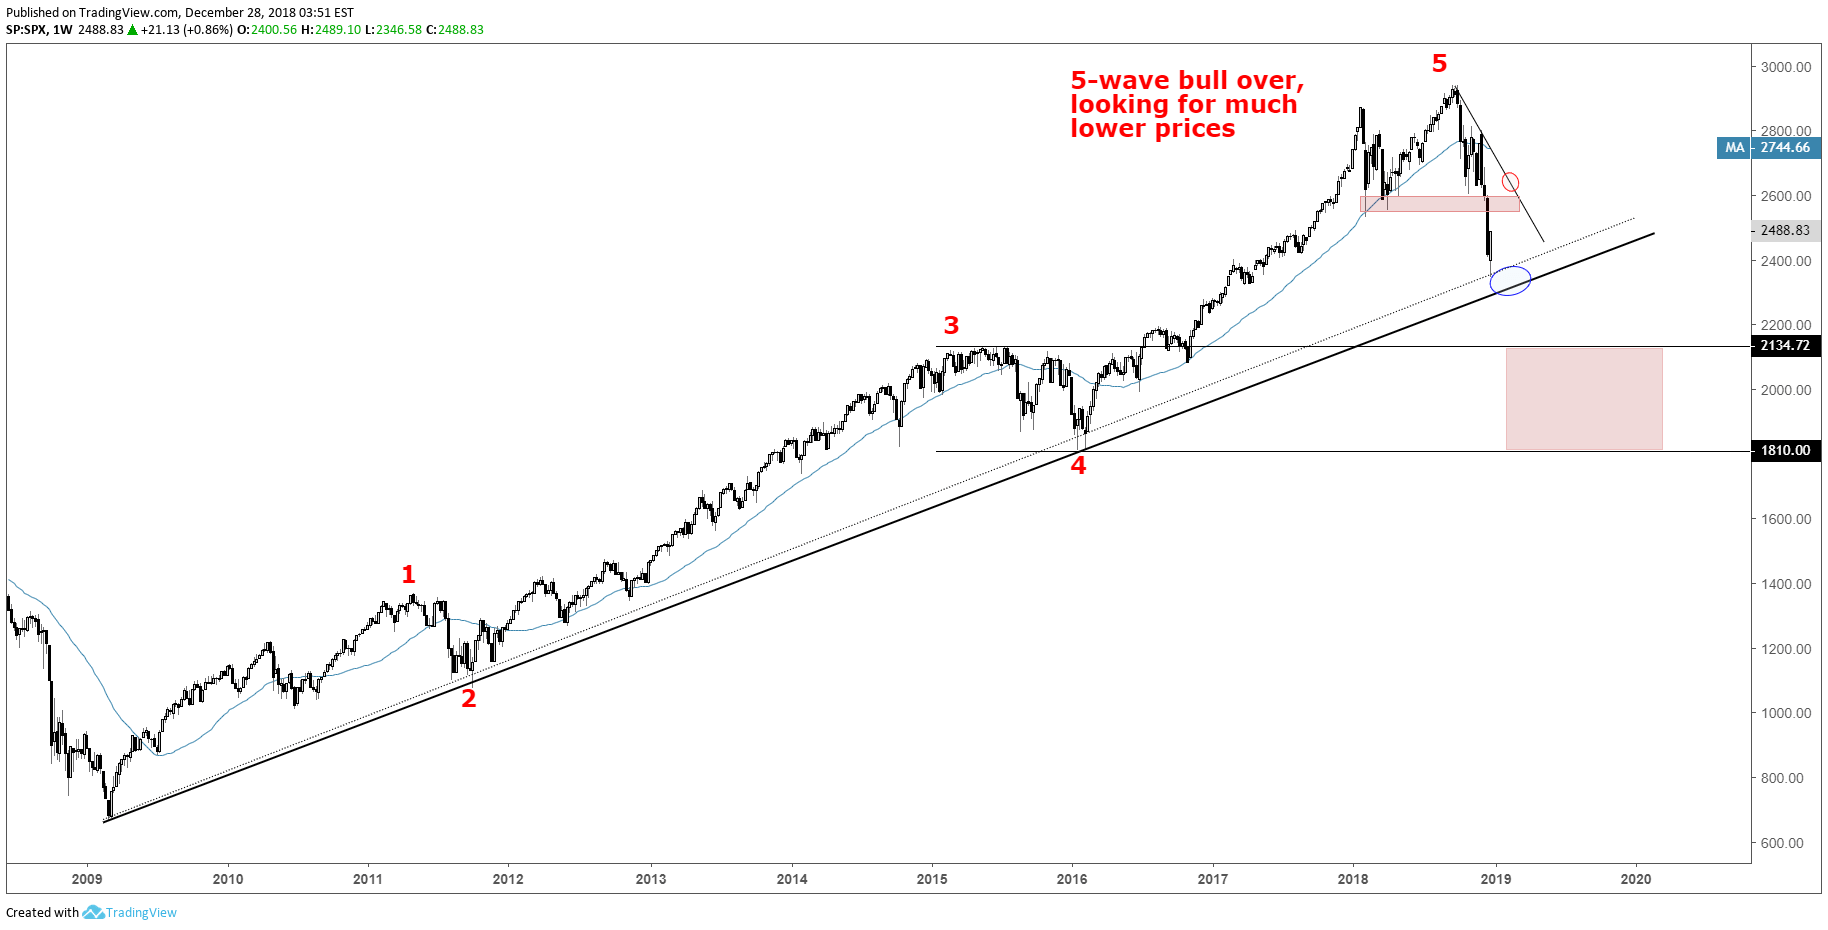
S&P 500 has in play test of ‘the’ bull market trend-line
The S&P 500 is trading around the bull market trend-line from the low in 2009. A sizable retracement is likely to take back some of the losses off the record highs. But not looking for it to last as the market looks headed to the drop zone from 2134 down to 1810, with expectations leaning towards the lower end of the zone as the last leg from 2016 up to the high in January is vulnerable to getting fully erased.
With global stocks having fallen sharply, see where our analysts see global markets headed in the Q1 Global Equities Forecast.
S&P 500 Weekly Chart (Bounce, then much lower)
Tools for Forex & CFD Traders
Whether you are a beginning or experienced trader, DailyFX has several resources available to help you; indicator for tracking trader sentiment, quarterly trading forecasts, analytical and educational webinars held daily, trading guides to help you improve trading performance, and one specifically for those who are new to forex.
---Written by Paul Robinson, Market Analyst
You can follow Paul on Twitter at @PaulRobinsonFX


