


ASEAN Technical Outlook – USD/PHP, USD/SGD, USD/IDR, USD/MYR
- Downside breakouts in USD/SGD, USD/MYR and USD/IDR may have been false ones
- The Singapore Dollar is now overshadowed by a falling wedge bullish reversal pattern
- USD/PHP is struggling to find direction as a descending trend line from October held
We released our 4Q forecasts for currencies like the US Dollar in the DailyFX Trading Guides page
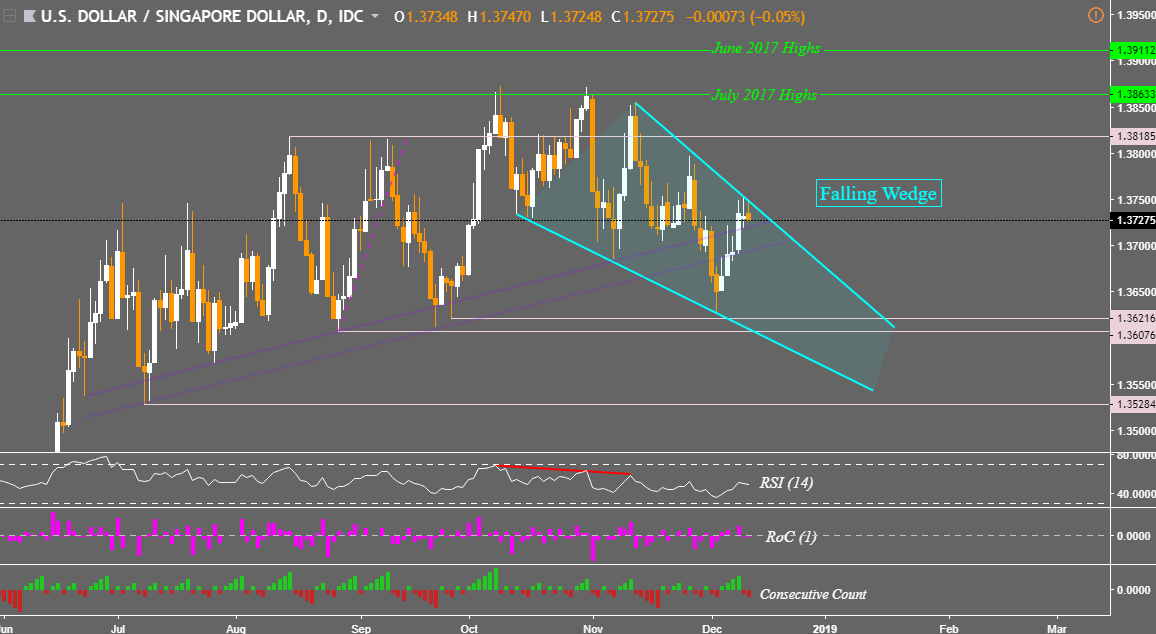
USD/SGD Technical Analysis – Falling Wedge Formation
Last time, USD/SGD prices broke below a rising range of support from June which might have been a precursor for more declines down the road. However, since then the Singapore Dollar weakened against its US counterpart and a new candlestick formation emerged. Looking at the daily chart below, we now have a falling wedge which is a bullish pattern that may insinuate a turn higher in USD/SGD down the road.
An ascent above the resistance line of the wedge would be a bullish signal and confirmation may have the pair eventually reaching the current 2018 highs just above 1.3863. Meanwhile support is a small horizontal range between 1.3607 and 1.3621. This area consists of the August and September lows coupled with the December 4th wick. For updates on the Singapore Dollar and other ASEAN pairs that I am closely watching, you may follow me on Twitter @ddubrovskyFX.
USD/SGD Daily Chart
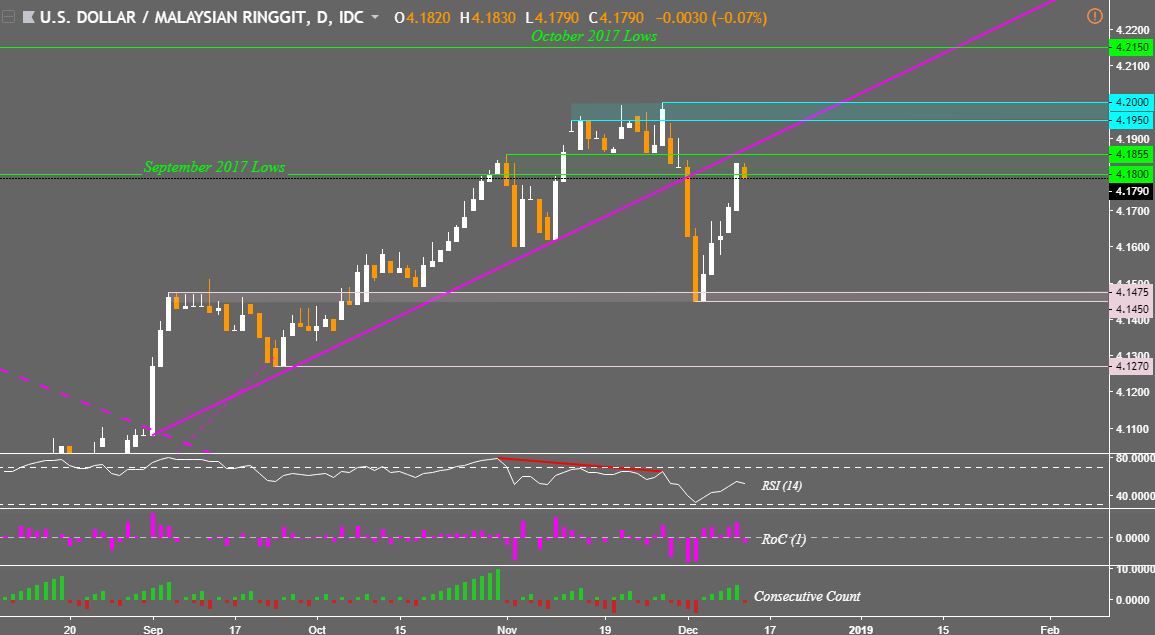
USD/MYR Technical Analysis – False Breakout?
Following a descent through a rising trend line from September, USD/MYR prices recovered in what for the time being appears to be a false breakout. The Malaysian Ringgit weakened against the US Dollar to a now familiar area of support/resistance consisting of the September 2017 lows (4.1800 – 4.1855). Interestingly, the rising support line from September is now acting as resistance as well. An ascent would open the door to testing the November highs (4.1950 – 4.2000). Near-term support is between 4.1450 and 4.1475.
USD/MYR Daily Chart
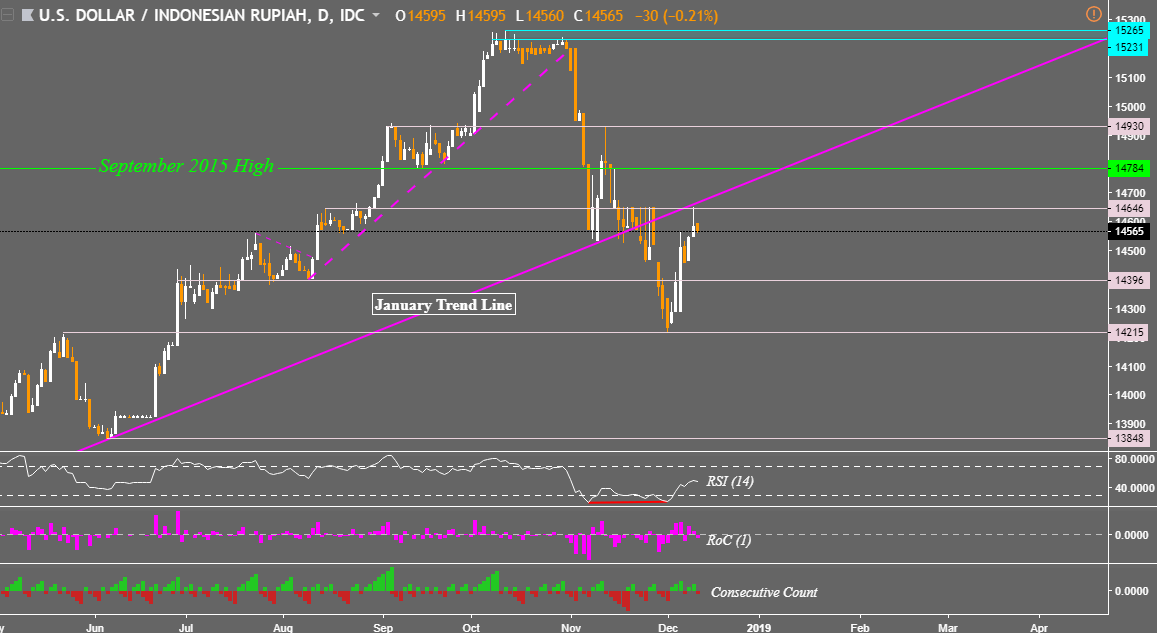
USD/IDR Technical Analysis – False Breakout Too?
Like the Malaysian Ringgit, a similar development could be found in the Indonesian Rupiah. USD/IDR prices initially broke through a rising support line from January and have since recovered back to it. Granted, positive RSI divergence overshadowed the pair. At times this can precede a turn higher as downside momentum fades. From here, immediate resistance is at 14,646. An ascent through that exposes the September 2015 high. Meanwhile, support is at 14,396 followed by the May high/December 3rd low at 14,215.
USD/IDR Daily Chart
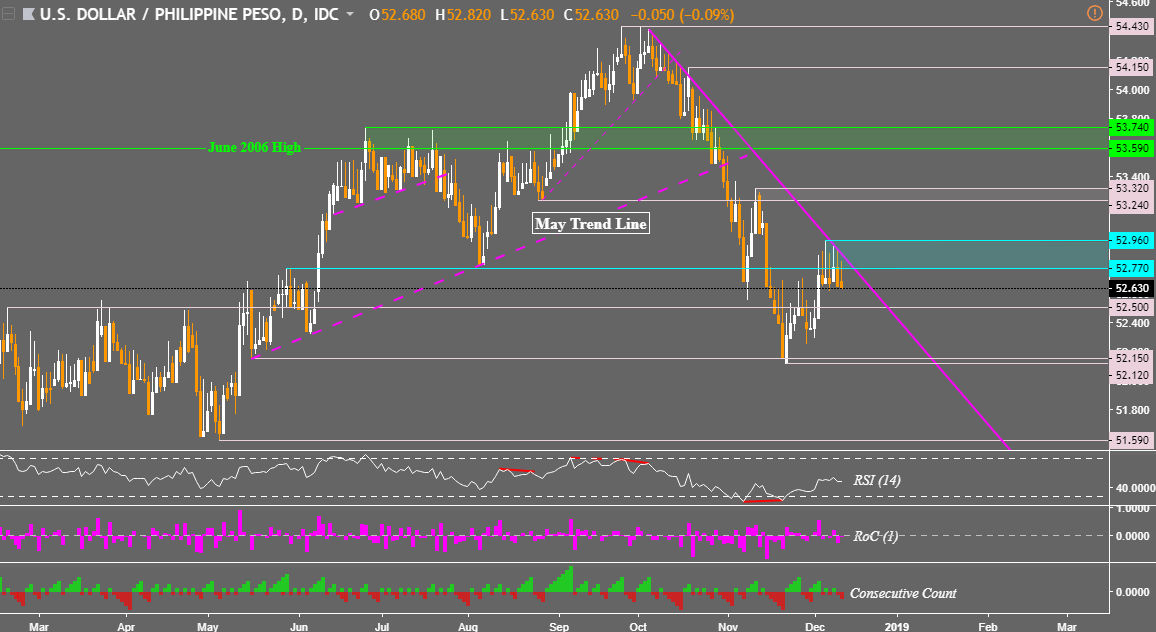
USD/PHP Technical Analysis – Trend Line Holds
The Philippine Peso is struggling to find direction against the US Dollar as the falling trend line from October holds. Meanwhile immediate resistance developed as a range between 52.77 and 52.96. Pushing above these may be a bullish precursor a reversal of the dominant downtrend in USD/PHP. This would expose resistance thereafter between 53.24 and 53.32. Meanwhile immediate support is the February high at 53.50 followed by the November low around 52.12.
USD/PHP Daily Chart
**All Charts Created in TradingView
Read this week’s ASEAN fundamental outlook to learn about the underlying drivers for these currencies!
FX Trading Resources
- Just getting started? See our beginners’ guide for FX traders
- Having trouble with your strategy? Here’s the #1 mistake that traders make
- See how the US Dollar is viewed by the trading community at the DailyFX Sentiment Page
--- Written by Daniel Dubrovsky, Junior Currency Analyst for DailyFX.com
To contact Daniel, use the comments section below or @ddubrovskyFX on Twitter


