


ASEAN Technical Outlook – USD/PHP, USD/SGD, USD/IDR, USD/MYR
- USD/SGD making bold upside push as bearish reversal warning sign pops up
- Last line of defense is keeping the dominant uptrend in USD/PHP prices intact
- USD/MYR eyes October 2017 resistance as USD/IDR remains in consolidation
We released our 4Q forecasts for currencies like the US Dollar in the DailyFX Trading Guides page
USD/SGD Technical Analysis – Upside Momentum is Fading
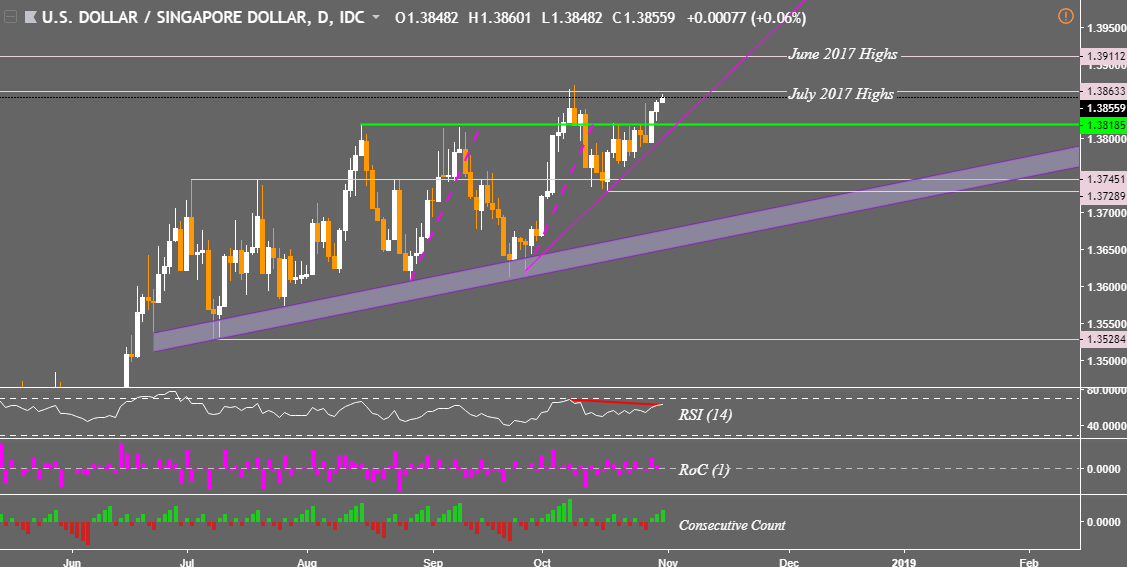
The Singapore Dollar is quickly losing ground against its US counterpart after USD/SGD closed at its highest since July 2017. The pair has broken above a horizontal resistance line around 1.38185 and remains supported by a rising trend line from September. However, negative RSI divergence warns that upside momentum is fading. Should 1.38633 hold, 1.38185 would be critical to watch in the event of a reversal. Meanwhile, an ascent above 1.38633 exposes the June 2017 highs.
USD/SGD Daily Chart
USD/PHP Technical Analysis – Dominant Uptrend At Risk
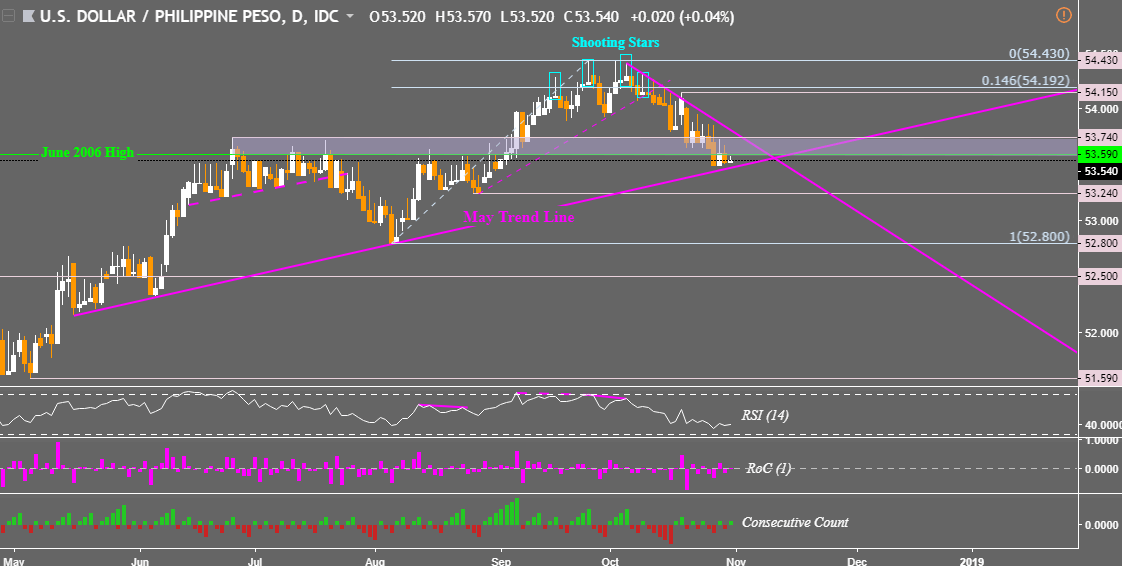
The last line of defense is keeping USD/PHP at bay since it started a near-term descent back in the beginning of October. A horizontal range of former resistance now support (53.59 – 53.74) was unable to prevent further loses. Now, a break through the rising trend line from May risks overturning the dominant uptrend. Such an outcome may precede further appreciation in the Philippine Peso. This would expose near-term support at 53.24 which is the late August low. A descent through that opens the door to testing 52.80 afterwards.
USD/PHP Daily Chart
USD/MYR Technical Analysis – Eyeing Horizontal Resistance from October 2017
On a weekly chart, USD/MYR has positioned itself to close above former horizontal support which kept prices from falling back in the latter half of 2017 on numerous occasions. Meanwhile the pair’s uptrend since April continues to be supported by rising trend lines. More weakness in the Malaysian Ringgit against the US Dollar will have it eyeing 4.2425 which is horizontal resistance from October 2017.
USD/MYR Weekly Chart

USD/IDR Technical Analysis – Still in Consolidation Mode
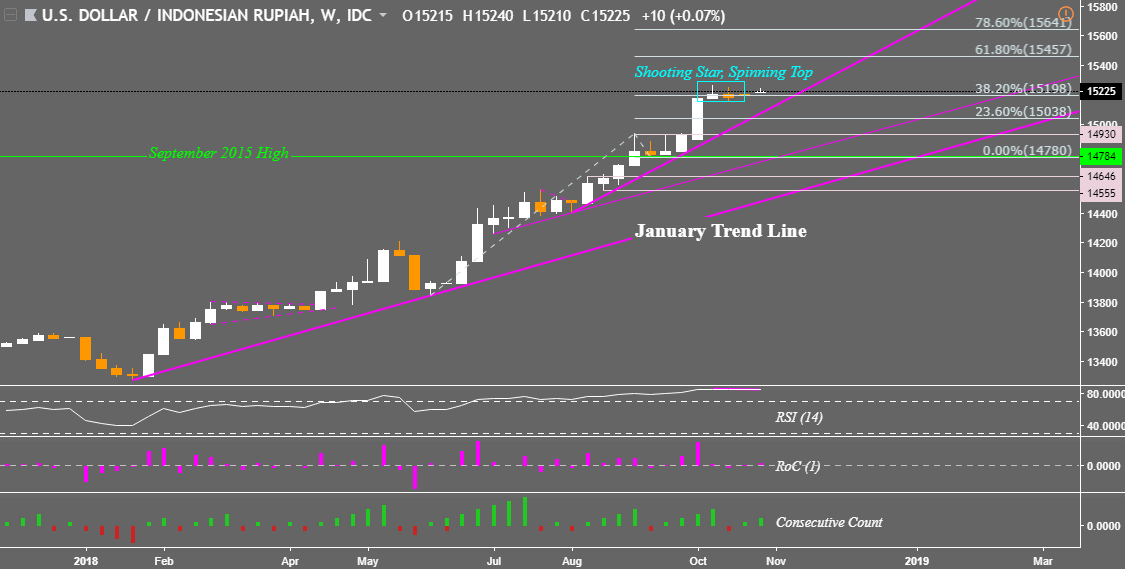
Despite bearish reversal warning signs pointed out last week, USD/IDR still remains in a consolidation mode. The Indonesian Rupiah is hovering around the 38.2% Fibonacci extension at 15,198. Negative RSI divergence still persists on the weekly chart, warning that its next leg could be lower. Should sideways price action resume, the pair will eventually face a rising support line from August. If this breaks, near-term support at 14,930 could be eyed. Meanwhile a push above immediate resistance exposes 15,457.
USD/IDR Weekly Chart
**All Charts Created in TradingView
Read this week’s ASEAN fundamental outlook to learn about the underlying drivers for these currencies!
FX Trading Resources
- Just getting started? See our beginners’ guide for FX traders
- Having trouble with your strategy? Here’s the #1 mistake that traders make
- See how the US Dollar is viewed by the trading community at the DailyFX Sentiment Page
--- Written by Daniel Dubrovsky, Junior Currency Analyst for DailyFX.com
To contact Daniel, use the comments section below or @ddubrovskyFX on Twitter


