


Gold is a market we continue to watch but avoid getting involved with; this will remain the case until it moves outside of the choppy environment dominating trade. Crude oil reversed off long-term resistance last week and could now be working on posting a lower high since then. The DAX had a powerful reversal yesterday from around support, while the S&P 500 reversed on Monday from its own levels of support; tilts near-term higher for these indices.
Technical Highlights:
- Gold price stuck in a range, need to be patient
- Crude oil turned off long-term resistance, has focus shifted lower
- DAX & S&P 500 looking to make good on reversals from support
See how the majority of traders are positioned in various markets/currencies and what it says about future price fluctuations – IG Client Sentiment
Gold price stuck in a range, need to be patient
Gold continues to be a difficult proposition with it having had little to no direction since August. This doesn’t mean we can fall asleep, but pressing it on either side of the tape at this time appears to be nothing more than speculation without a solid edge. Watch 1180 on the downside (close by) and the April trend-line and 1215 on the top-side.
Gold Daily Chart (Stuck in chop-mode)

For our intermediate-term fundamental and technical take, see the Q4 Gold Forecast
Crude oil turned off long-term resistance, has focus shifted lower
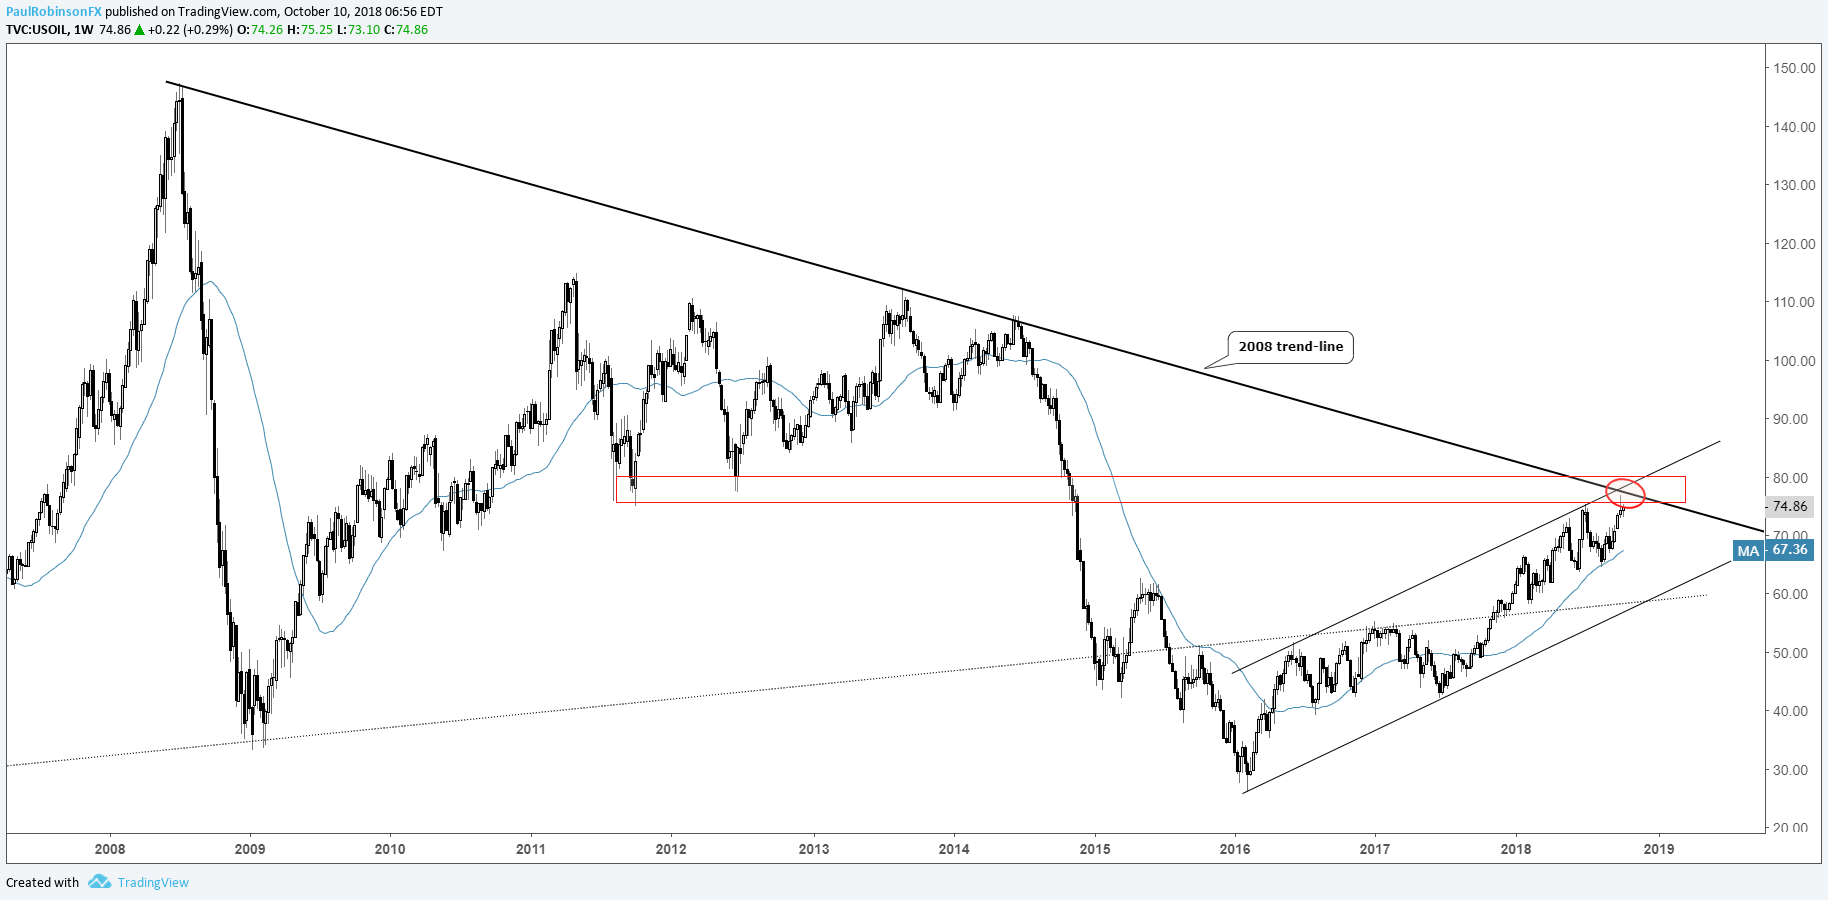
Last week, crude oil turned down from lows created in 2011 and right around the 2008 trend-line. The weekly reversal bar created wasn’t super powerful, but enough to suggest momentum could turn bearish from here.
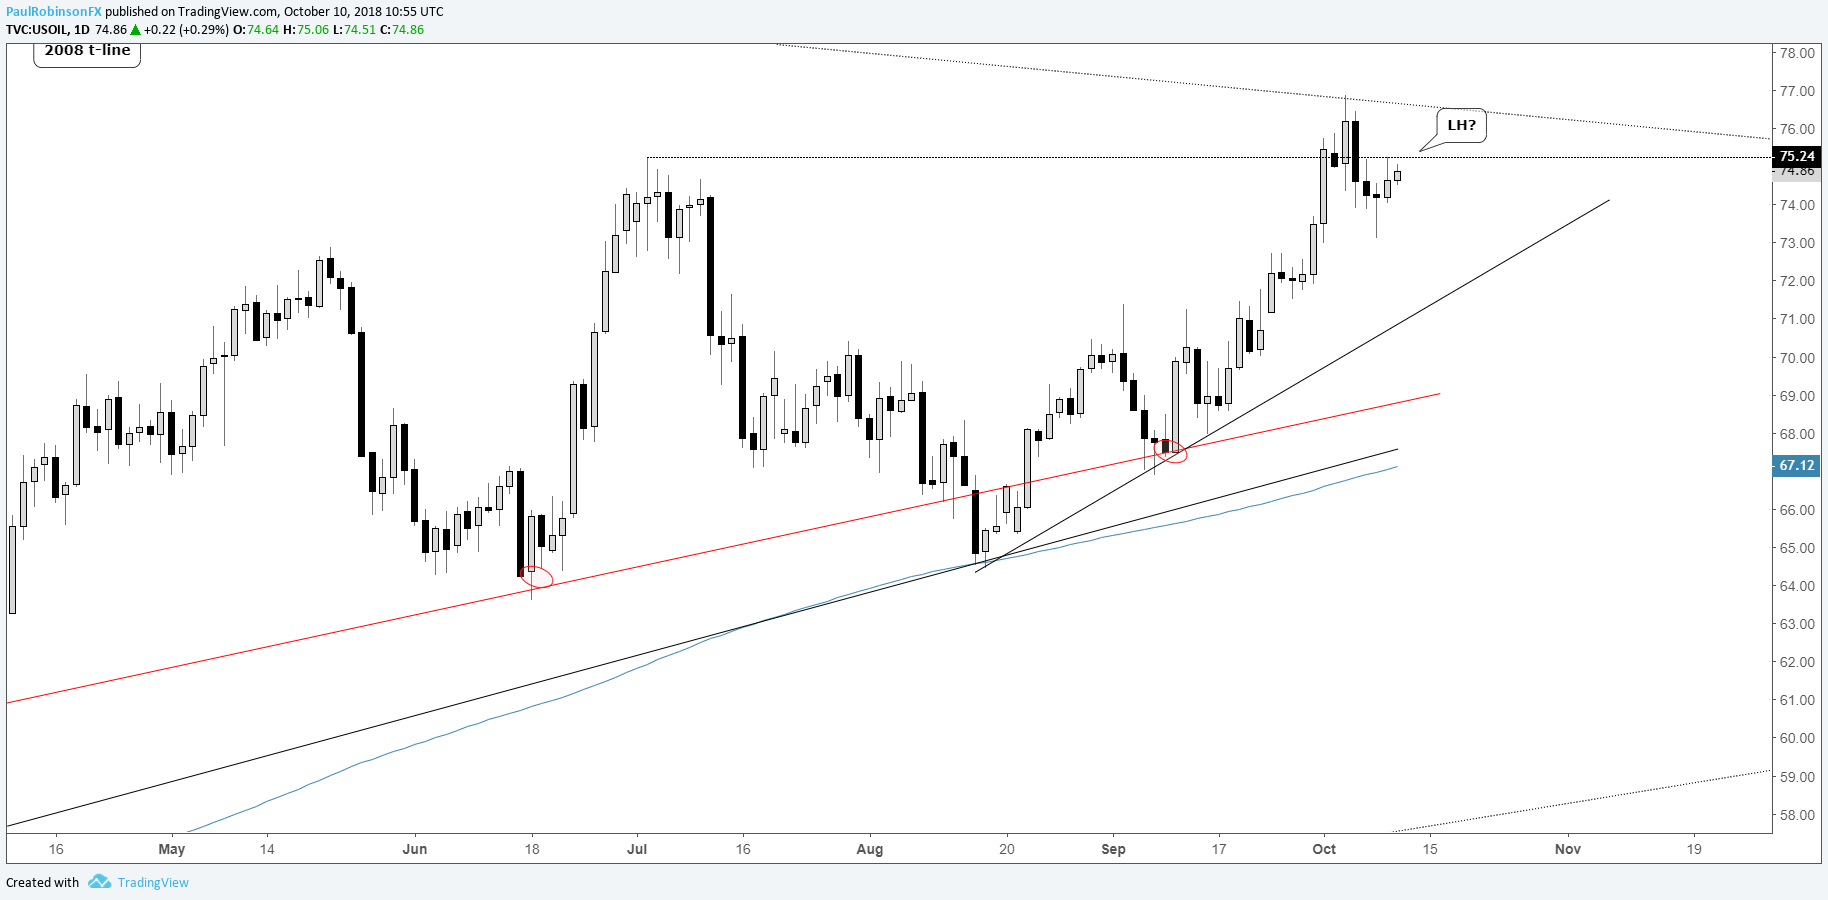
A lower higher from last week’s peak may be on the verge of being cemented here shortly. If this turns out to be the case, then a drop back to the trend-line from mid-August looks to be in the cards; this line currently arrives around the 72-mark.
Crude Oil Weekly Chart (Long-term resistance)
Crude Oil Daily Chart (Lower high?)
For our intermediate-term fundamental and technical take, see the Q4 Crude Oil Forecast
DAX & S&P 500 looking to make good on reversals from support
The DAX was down big at one point yesterday, taking out a couple of lines of support nearing the March lows before reversing sharply higher. The stronger key-reversal is seen as keeping a floor in the market for now. Today we are seeing a minor reversal so far off yesterday’s afternoon surge. A higher low from yesterday’s low within the context of a key-reversal day could make for a bullish set-up. A break of Tuesday’s low at 11803 negates a bullish outlook. Given how strong the turnabout was a test of the 12100-area could be in store.
DAX Daily Chart (Strong reversal around support)

For our intermediate-term fundamental and technical take, see the Q4 Global Equities Forecast
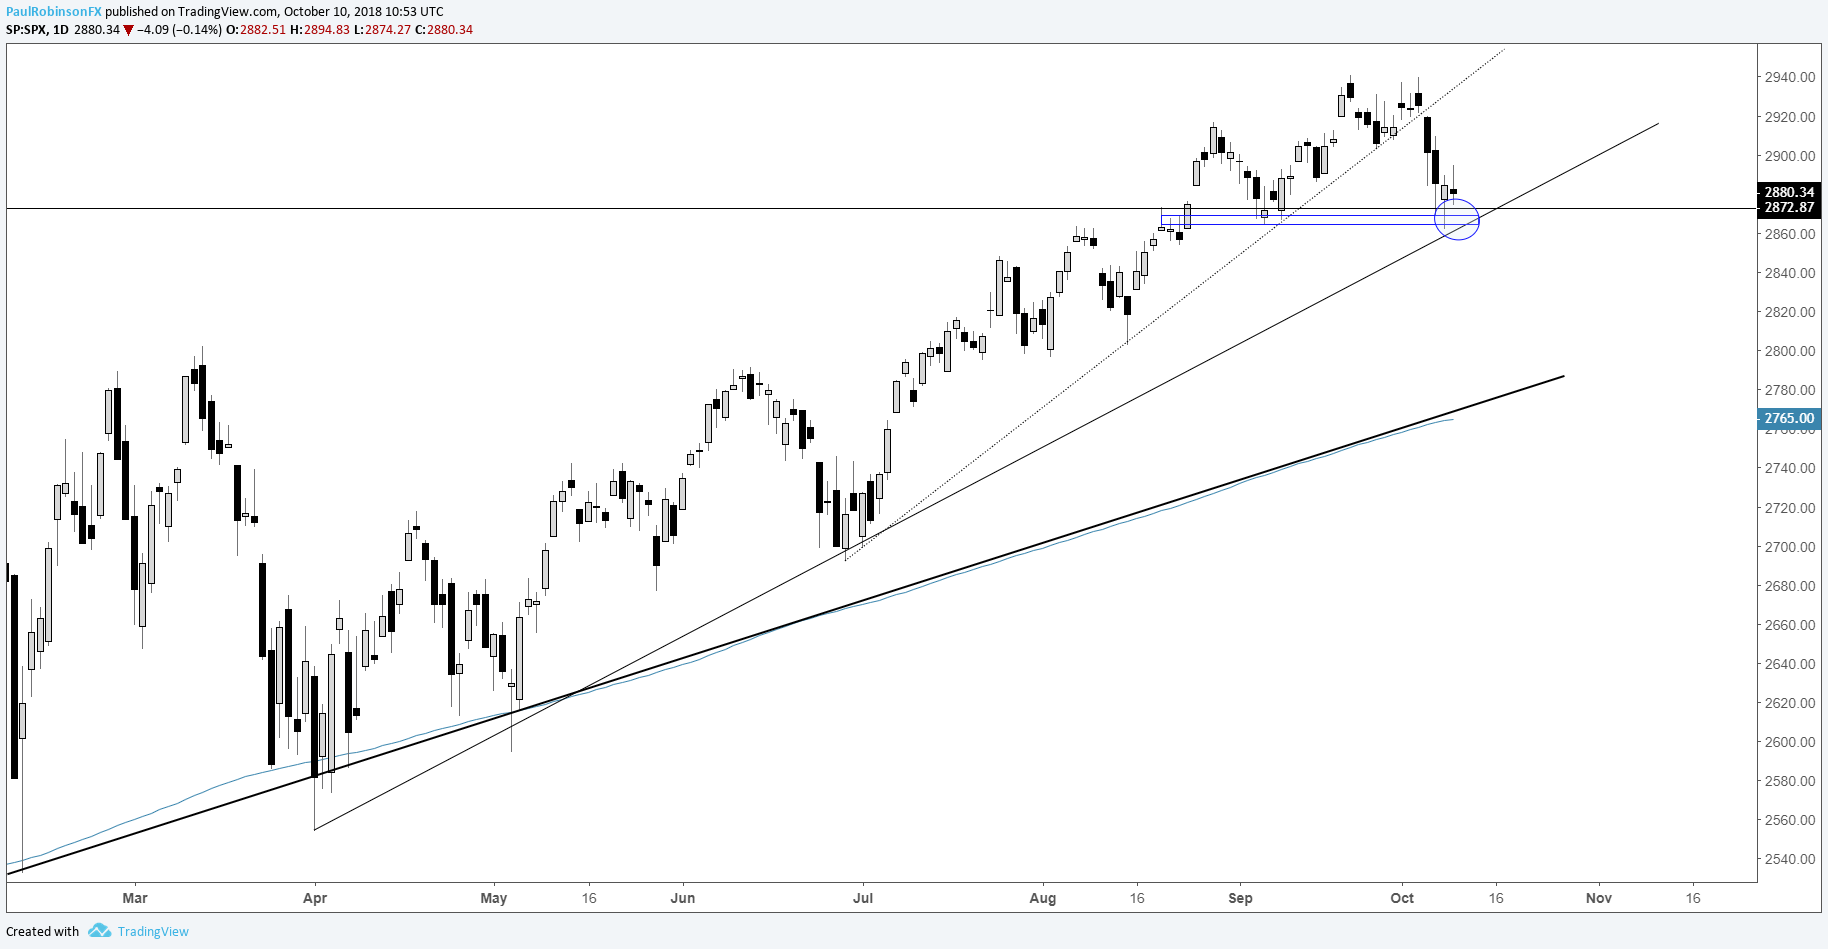
On Monday, the S&P traded down into confluence of support consisting of lows from a month-ago and the trend-line from April. The reversal to start the week has the market geared up for higher prices in the near-term. A violation of Monday’s low will negate this bias. A scenario which could come into play involves a small rally turning into the right shoulder of a head-and-shoulders pattern going back to late August. Just a possible scenario for now, running with strength at the moment.
S&P 500 Daily Chart (Trying to hold support)
Resources for Index & Commodity Traders
Whether you are a new or an experienced trader, DailyFX has several resources available to help you; indicator for tracking trader sentiment, quarterly trading forecasts, analytical and educational webinars held daily, trading guides to help you improve trading performance, and one specifically for those who are new to forex.
---Written by Paul Robinson, Market Analyst
You can follow Paul on Twitter at @PaulRobinsonFX


