


Dow Jones Talking Points:
- The Dow Jones Industrial Average saw prices test below a key support level that had helped to hold the lows last week. Resistance has built-in from around the 26k level on the chart.
- While near-term prices have pulling back, the longer-term trend remains bullish as the topside breakouts from July and August have yet to be significantly erased. This morning saw Dow futures test below the 14.4% Fibonacci retracement of the recent bullish breakout, and deeper support could be sought around the 23.6% marker of that same major move.
- DailyFX Forecasts on a variety of currencies such as the US Dollar or the Euro are available from the DailyFX Trading Guides page. If you’re looking to improve your trading approach, check out Traits of Successful Traders. And if you’re looking for an introductory primer to the Forex market, check out our New to FX Guide.
Do you want to see how retail traders are currently trading the US Dollar? Check out our IG Client Sentiment Indicator.
Dow Drops After Build of Resistance at 26k
US equities are pulling back after last week saw the Dow Jones spend most of the period digging into support. As we had discussed on Friday, the Dow Jones had established support off of a prior swing high, taking place around the 25,886 level. After multiple tests of that support level last week, corresponding resistance had started to show at the under-side of the 26,000 level, which held resistance into last week’s close.
But that theme of pullbacks has drawn deeper this week as Dow prices have tested below 25,886. As we looked at last week, given the recurrence of support tests around that level, it was unlikely to hold for much longer, and this brought attention to deeper support potential around prior swing-highs of 25,695 and 25,500.
Dow Jones Four-Hour Price Chart: Fresh Two-Week Lows as 26k Resistance Holds the Highs

Chart prepared by James Stanley
At this stage, the trend in the index remains up as we’re continuing to hold on to the bulk of the gains that showed during the July and August bullish breakouts; but given the early stages of support giving way, we may have a deeper retracement to work with until that longer-term bullish trend is ready for continuation.
Considering the bullish breakouts that drove prices for the past two months, price action remains rather elevated, as we’ve just fallen below the 14.4% Fibonacci retracement of the July-August major move. This places further emphasis on that level around 25,695, as this is confluent with the 23.6% marker of that same study, while also having helped form the early-August swing-high. A bit-lower, around that 25,500 marker, we have a trend-line projection as taken from the June, July and August swing-lows.
Dow Jones Four-Hour Price Chart
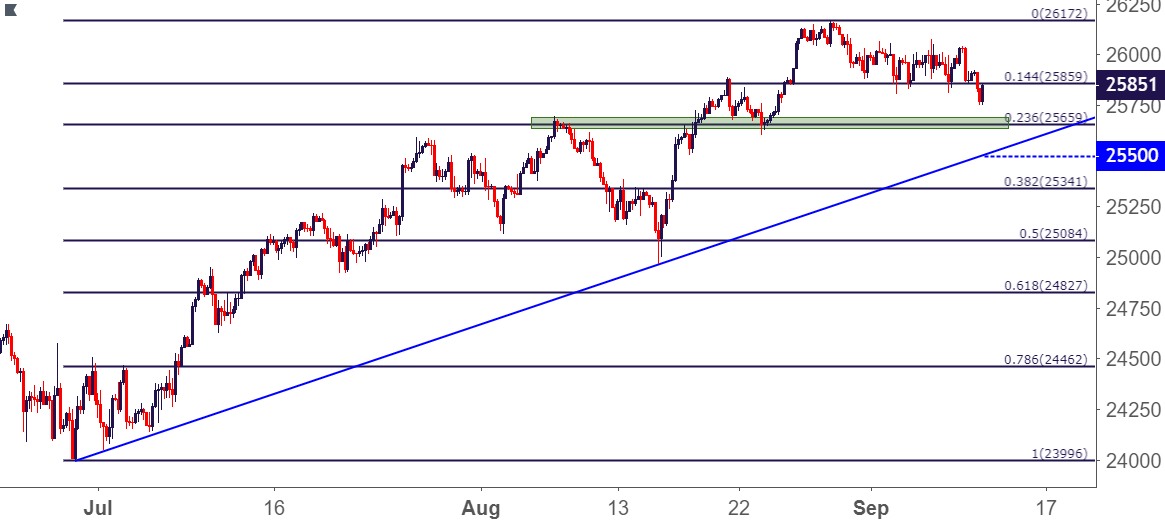
Chart prepared by James Stanley
Bearish Dow Outlooks
Given how entrenched that prior bullish trend had become, combined with how mild the pullback we’ve seen so far is at this early stage, and getting bearish on US stocks could remain as a challenge. While equities in Europe and the UK have been on offer for much of the past two weeks, both the Dow and S&P had held at key support levels until the current down-side break began to show.
A big area exists on the chart around 25,370, as this is the 14.4% Fibonacci retracement of the post-Election move in the Dow, and 29 points lower we have the 38.2% retracement of the July-August bullish breakout. If the Dow is able to test below this level, the prospect of bigger picture bearish themes will begin to look more attractive; but the question remains as to whether equity weakness is best sought out in the US, or another index from across the Atlantic that’s already begun to show bigger-picture downside pressure.
Dow Jones Eight-Hour Price Chart: Confluence Around 25,341-25,370

Chart prepared by James Stanley
You may also be interested in:
The Dow Spends a Week at Support: Will Bulls Follow-Through?
Equity Forecast for Dow, S&P 500, DAX, FTSE and Nikkei
Day Trading the Dow Jones: Strategies, Tips & Trading Signals
To read more:
Are you looking for longer-term analysis on the U.S. Dollar? Our DailyFX Forecasts for Q3 have a section for each major currency, and we also offer a plethora of resources on USD-pairs such as EUR/USD, GBP/USD, USD/JPY, AUD/USD. Traders can also stay up with near-term positioning via our IG Client Sentiment Indicator.
Forex Trading Resources
DailyFX offers a plethora of tools, indicators and resources to help traders. For those looking for trading ideas, our IG Client Sentiment shows the positioning of retail traders with actual live trades and positions. Our trading guides bring our DailyFX Quarterly Forecasts and our Top Trading Opportunities; and our real-time news feed has intra-day interactions from the DailyFX team. And if you’re looking for real-time analysis, our DailyFX Webinars offer numerous sessions each week in which you can see how and why we’re looking at what we’re looking at.
If you’re looking for educational information, our New to FX guide is there to help new(er) traders while our Traits of Successful Traders research is built to help sharpen the skill set by focusing on risk and trade management.
--- Written by James Stanley, Strategist for DailyFX.com
Contact and follow James on Twitter: @JStanleyFX


