


Nasdaq 100 Highlights:
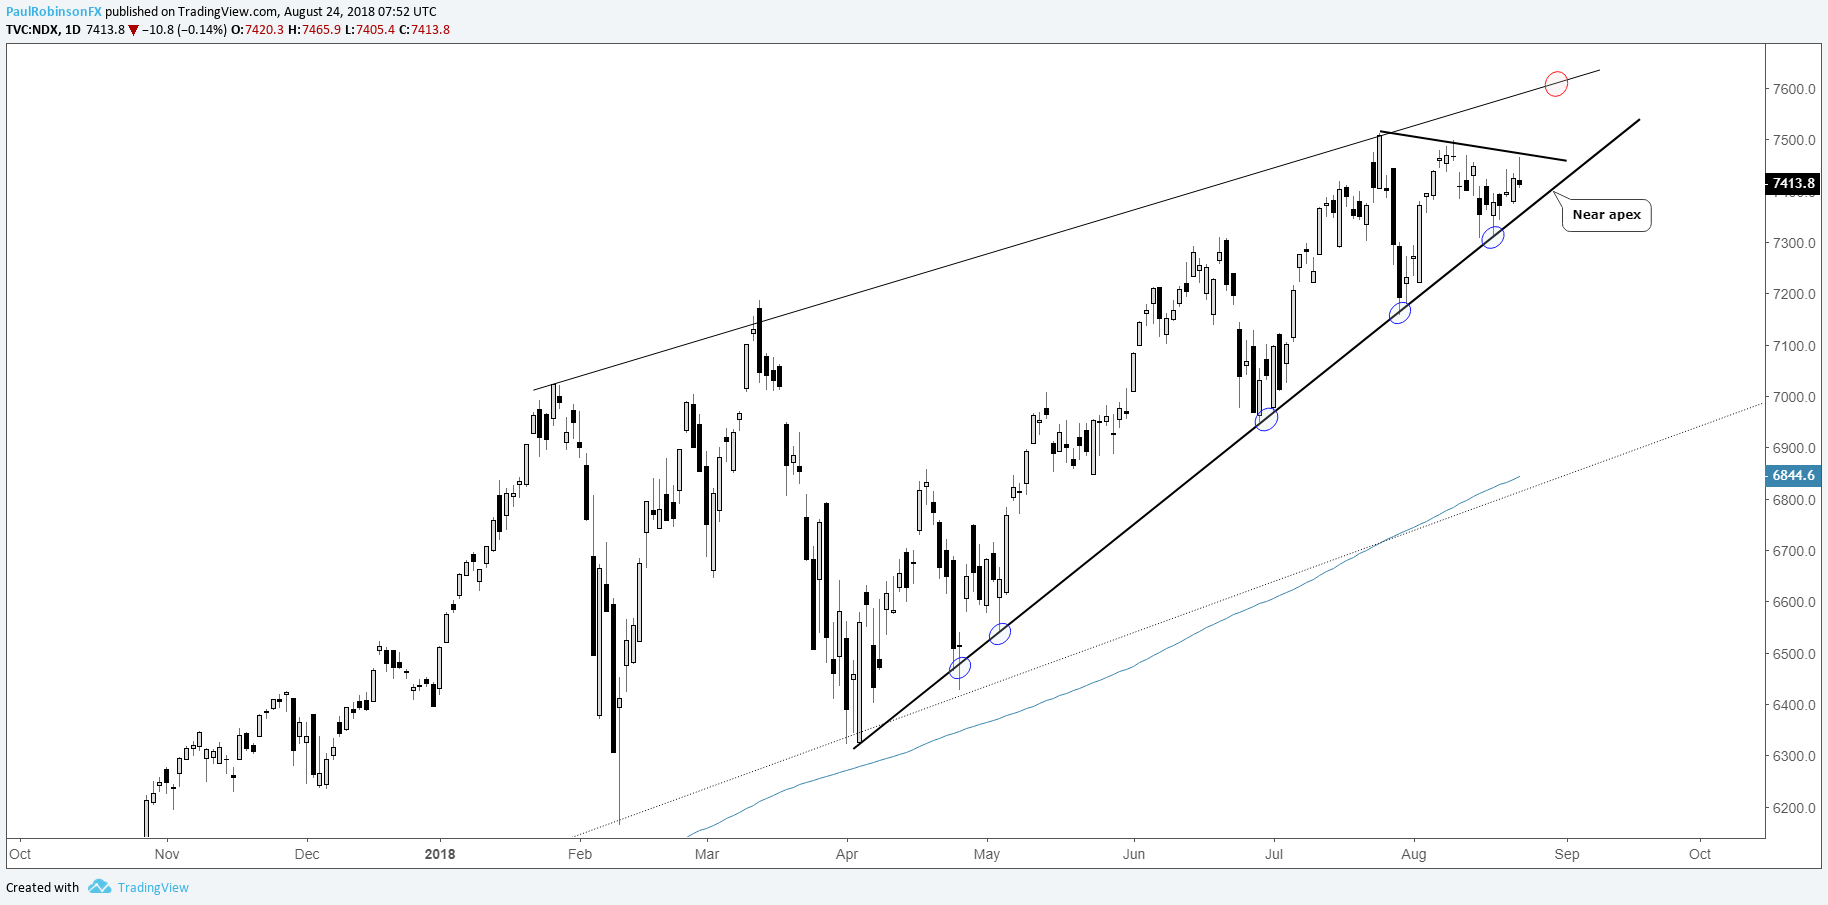
- Chart taking on the shape of a triangle
- Trend implies upside breakout, but…
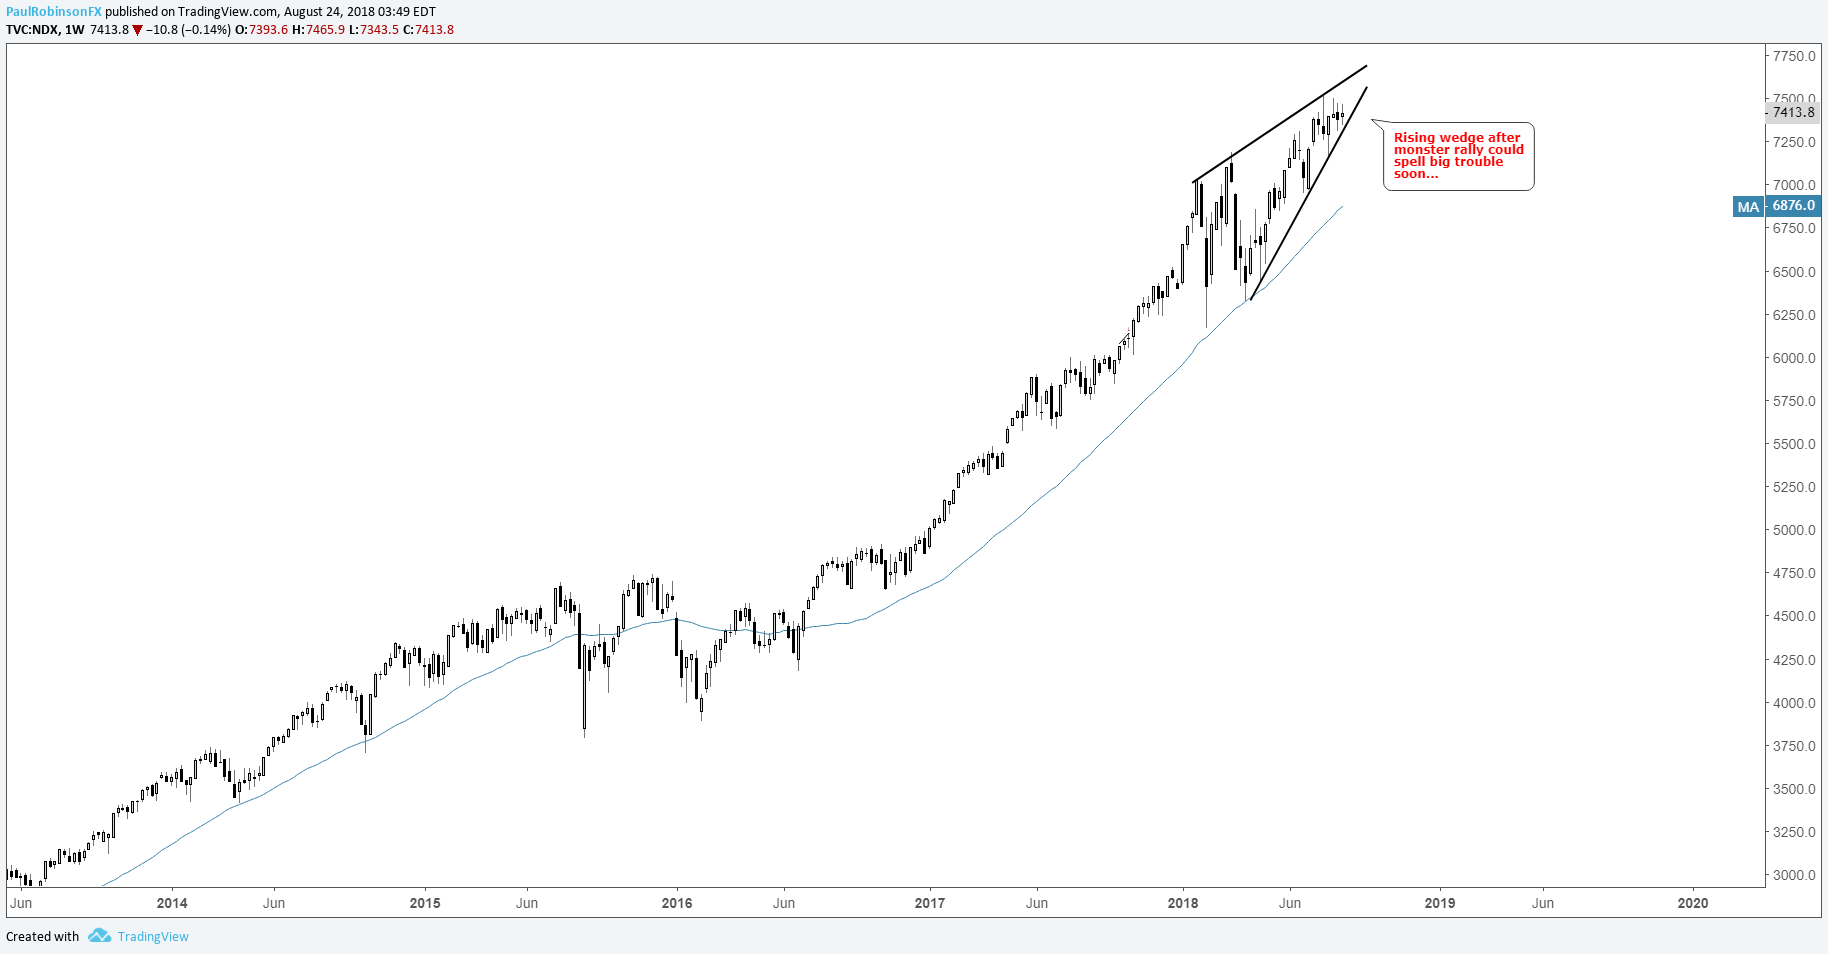
- Larger rising wedge is still very much in play
For longer-term trading ideas, Q3 forecasts, and a library of educational content, check out the DailyFX Trading Guides
The Nasdaq 100 is trading at about the same price it was at a month-ago, but the developing triangle since then suggests that is about to change as the apex quickly nears. In-line with the trend, the symmetrical pattern is poised to lead the index higher. It’s worth noting that the Russell 2000 (small-cap index) just the other day broke out of a similar pattern.
Should we see a bullish breakout, it’s almost certain to lead to a record high, but keep in mind that a larger, rising wedge, developing since January could put the brakes on a rally up near 7600 where the top-side trend-line of the pattern lies. This is a pattern we began discussing recently and its implications could soon be felt, especially if it breaks the underside the pattern.
Speaking of the underside of the pattern, the same trend-line which makes up the shorter-term symmetrical triangle also belongs to the potentially ominous rising wedge. With that in mind, a downside break could bring with it major bearish implications. (Still could make for a big top if we a rally result in an overthrow of the rising wedge then price declines below the lower trend-line. More to come on this if it becomes relevant…)
It seems for now, though, the market is likely to climb higher before we need to concern ourselves with any sizable downdrafts. Keeping it simple, we’ll run with the direction of the break take it from there instead of playing the prediction game.
The other day we were discussing the Dow and the inverse pattern (reverse symmetrical triangle) it is building to the one nearing completion in the Nasdaq 100, and perhaps paradoxically, it could have the same implications. Bottom line, when the price sequence neatly converges or expands it often times signaling that the market is about to make a material move.
Tough stretches are part of trading, which is why we’ve designed a guide with 4 key tenets to building confidence in trading.
Nasdaq 100 Daily Chart (Triangle)
Nasdaq 100 Weekly Chart (Rising Wedge)
We just put together a piece recently highlighting the differences between the three major U.S. indices – ‘Difference Between Dow, Nasdaq, and S&P 500: Major Facts & Opportunities.’. Check it out to learn the varying characteristics one should know if you are going to trade them.
Resources for Forex & CFD Traders
Whether you are a new or experienced trader, we have several resources available to help you; indicator for tracking trader sentiment, quarterly trading forecasts, analytical and educational webinars held daily, trading guides to help you improve trading performance, and one specifically for those who are new to forex.
---Written by Paul Robinson, Market Analyst
You can follow Paul on Twitter at @PaulRobinsonFX


