


Crude Oil Technical Highlights:
- WTI crude oil trading below July ’17 slope
- Currently at confluence of support
- A break of all support tilts chart lower
- Speculators very long oil contracts
For more in-depth fundamental and technical analysis, check out the Q3 Forecast for Crude Oil
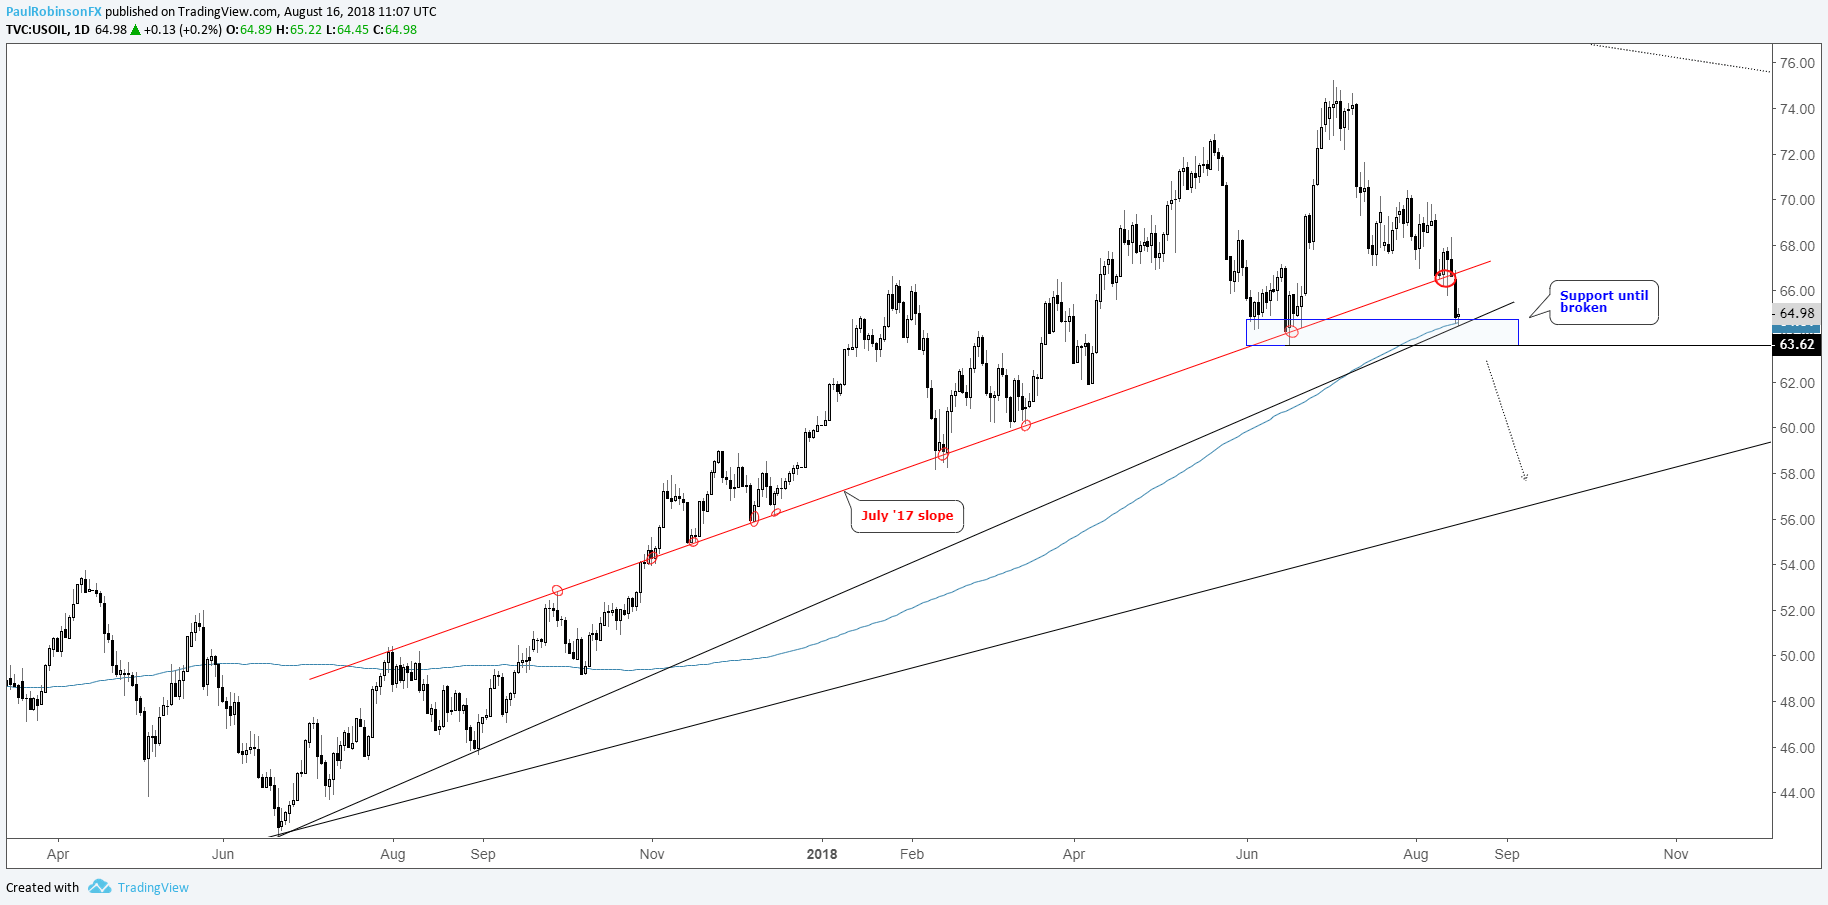
WTI crude oil trading below July ’17 slope
As of late, in the Tuesday commodities/equity tech webinars, we’ve been discussing the slope rising up from July of last year. It’s an important one given the number of times oil has either turned off of it or at least hesitated before continuing on.
Friday and Monday brought two attempts to turn higher off the slope, but with yesterday’s decline it was finally broken for the first time. This is a demonstration of an important change in character, as each time this year the market quickly turned higher once the line-in-the-sand was met.
At the time of this writing, crude is trading another at an important spot of confluence: 200-day MA, trend-line from June ’17, and near the lows from June. A close below 63.62 will have the last of support broken and the chart tilting lower for the first since last year.
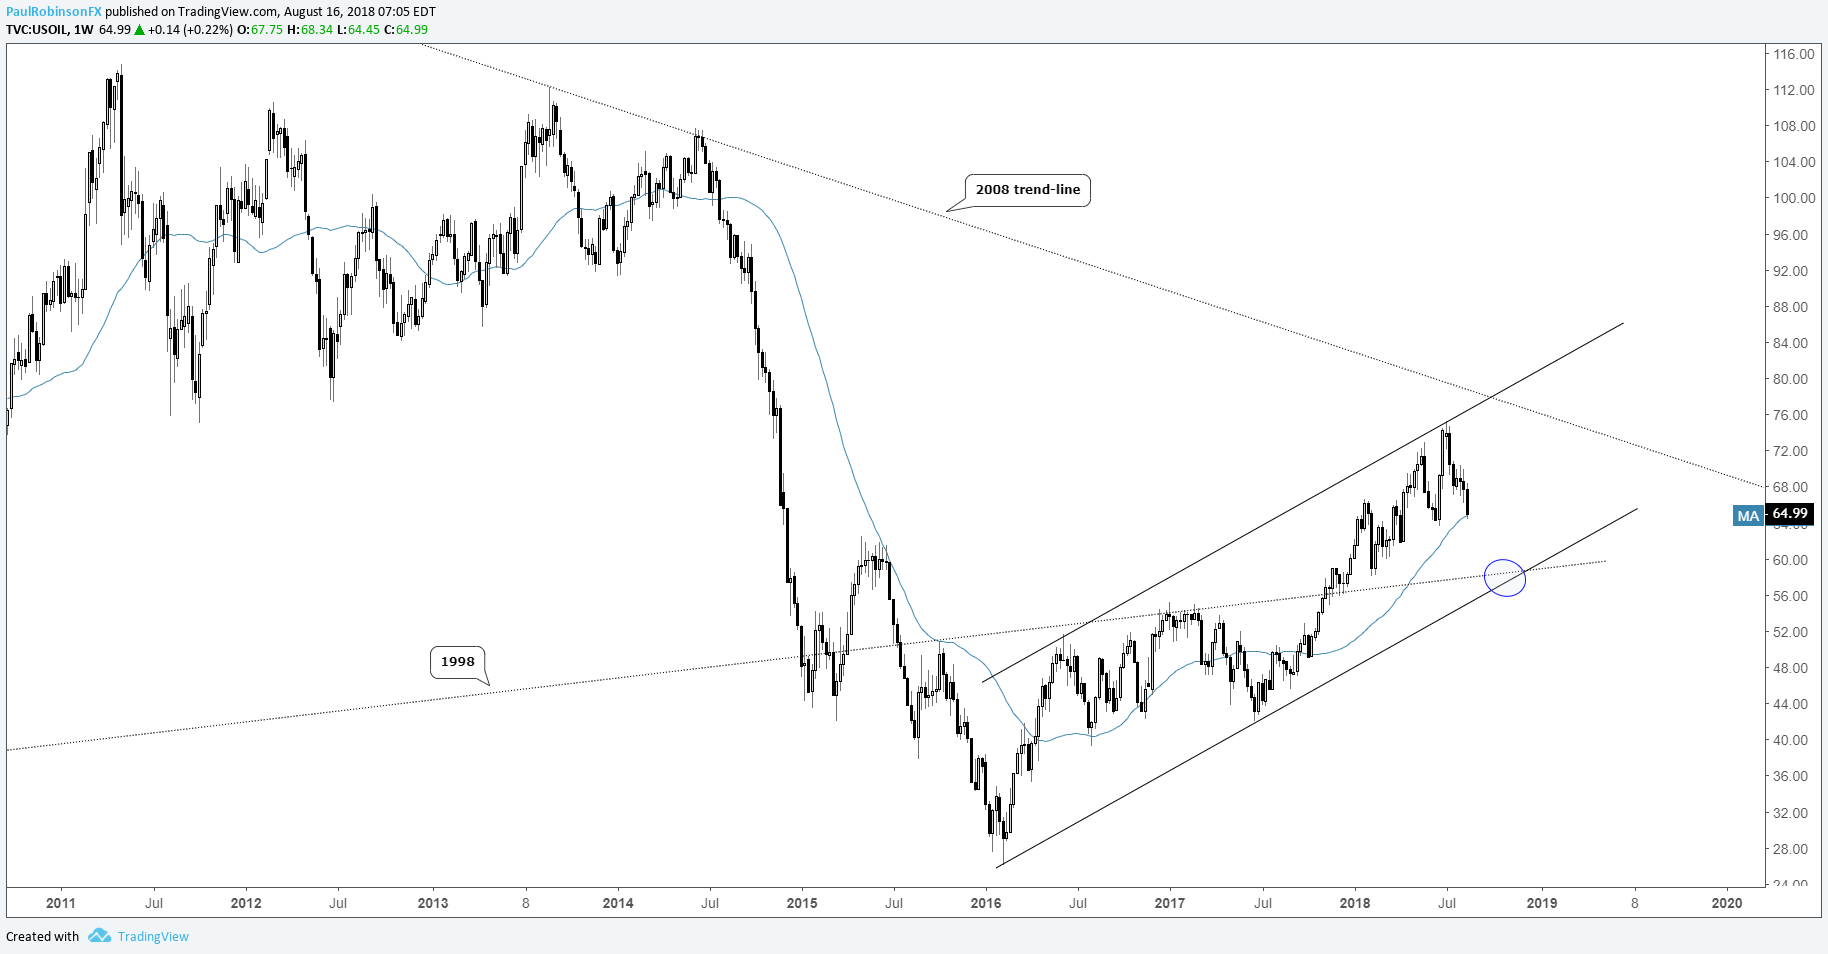
Upon a confirmed break (which may not happen right away), the initial target is the lower parallel running up from the 2016 low and trend-line passing through from 1999. Depending on the timing, given the upward sloping nature of these lines, the target is set around ~56/59.
See how the majority of traders are positioned in various markets/currencies and what it says about future price fluctuations – IG Client Sentiment
WTI Crude Oil Daily Chart (July ’17 slope broken)
WTI Crude Oil Weekly Chart (targeting lower parallel on breakdown)
Speculators very long oil contracts
On a side note, one factor which may finally come to matter to the market is positioning in the futures market. Per the CoT report, large speculators (i.e. – CTAs, hedge funds, etc.) collectively built an enormous long position during the bull-market move. With the trend never really in question, bullish became more bullish. However, with the trend coming under fire, this group of trend-followers may look to abandon ship as weakness sets in. Price may get driven lower in a hurry should everyone head for the exit at once. (Check out the most recent CoT overview.)
Crude Oil CoT Chart (Market very long)

Resources for Index & Commodity Traders
Whether you are a new or an experienced trader, DailyFX has several resources available to help you; indicator for tracking trader sentiment, quarterly trading forecasts, analytical and educational webinars held daily, trading guides to help you improve trading performance, and one specifically for those who are new to forex.
---Written by Paul Robinson, Market Analyst
You can follow Paul on Twitter at @PaulRobinsonFX


