


Talking Points:
- US stocks have paused from the bullish breakouts that have showed through August. The pullback is showing to varying degrees across the indices, with the tech-heavy Nasdaq 100 holding very near the highs while the S&P has posed a shallow pullback. The Dow Jones, on the other hand, is looking to be in more of a retracement as prices have sold-off along a bearish trend-line taken from the Tuesday morning highs.
- Tomorrow brings a key piece of inflation data to the table with the release of July inflation numbers out of the United States. The expectation is for a second consecutive month at 2.9%, and if we do see this come in below-line, stocks could catch a bid to move back towards those prior highs.
- DailyFX Forecasts are available from the DailyFX Trading Guides page. If you’re looking to improve your trading approach, check out Traits of Successful Traders. And if you’re looking for an introductory primer to the Forex market, check out our New to FX Guide.
Do you want to see how retail traders are currently trading the US Dollar? Check out our IG Client Sentiment Indicator.
US Stocks Pull Back
The up-trend in US stocks has hit the pause button over the past two days. Prices are pulling back, albeit to varying degrees across US indices. The Nasdaq 100 is holding very near those recent highs, while the S&P 500 has posed a mild dip. In the Dow Jones, however, the pullback has been a bit more consistent as a descending trend-line has shown when taken from the Tuesday morning highs.
Dow Jones Industrial Average Hourly Price Chart: Pullback From Tuesday Morning Highs

Chart prepared by James Stanley
In the above chart, we’ve also drawn a parallel trend-line underneath recent price action to illustrate a possible bull flag formation. This becomes interesting for strategies around bullish continuation, particularly if we see prices break above recent swing highs. This would be for traders looking to treat the Dow in an aggressive manner, and if we see a break above the swing-high at 25,631, the door could re-open to topside momentum strategies.
Dow Jones Hourly Price Chart
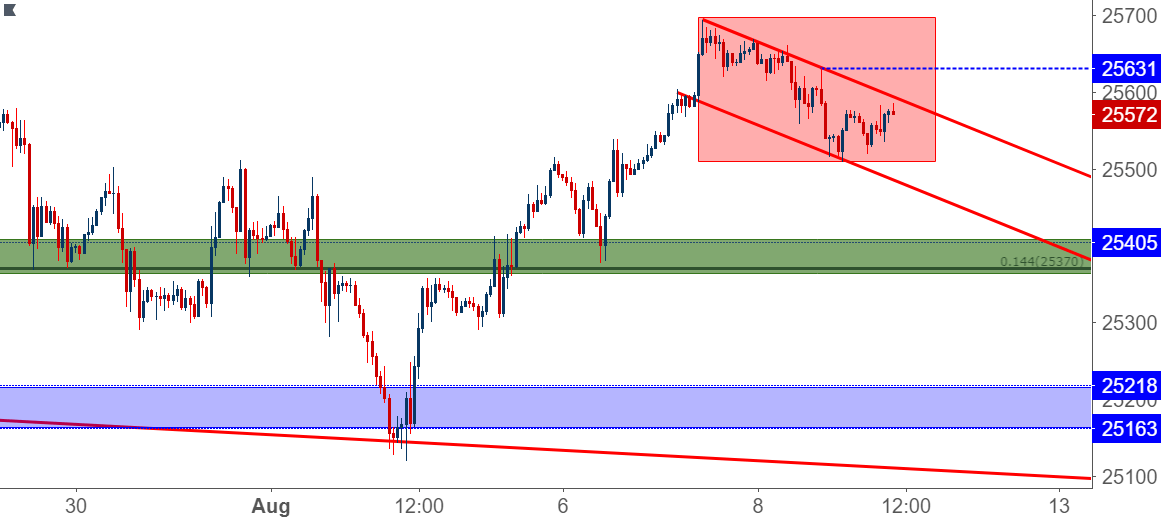
Chart prepared by James Stanley
If we do not get that topside break, or for traders that would like to move-forward in a bit more of a conservative manner, the same strategy we looked at on Tuesday could still be applied, with traders looking to react to support tests at previously-defined zones. The nearest of which exists around the 14.4% Fibonacci retracement of the post-Election move at 25,370, and this is followed by an area of prior support/resistance that came into play from 25,163 up to 25,218.
Dow Jones Four-Hour Price Chart: Deeper Pullback Potential as the August Breakout Settles
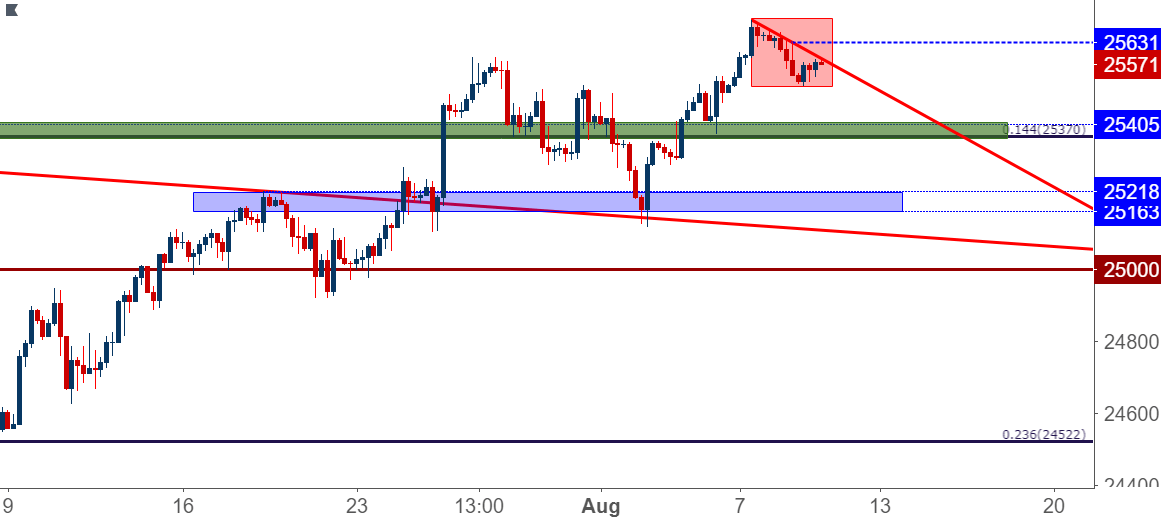
Chart prepared by James Stanley
To read more:
Are you looking for longer-term analysis on the U.S. Dollar? Our DailyFX Forecasts for Q1 have a section for each major currency, and we also offer a plethora of resources on USD-pairs such as EUR/USD, GBP/USD, USD/JPY, AUD/USD. Traders can also stay up with near-term positioning via our IG Client Sentiment Indicator.
Forex Trading Resources
DailyFX offers a plethora of tools, indicators and resources to help traders. For those looking for trading ideas, our IG Client Sentiment shows the positioning of retail traders with actual live trades and positions. Our trading guides bring our DailyFX Quarterly Forecasts and our Top Trading Opportunities; and our real-time news feed has intra-day interactions from the DailyFX team. And if you’re looking for real-time analysis, our DailyFX Webinars offer numerous sessions each week in which you can see how and why we’re looking at what we’re looking at.
If you’re looking for educational information, our New to FX guide is there to help new(er) traders while our Traits of Successful Traders research is built to help sharpen the skill set by focusing on risk and trade management.
--- Written by James Stanley, Strategist for DailyFX.com
Contact and follow James on Twitter: @JStanleyFX


