


Technical Highlights:
- Gold testing major support/pattern; Crude oil, is there a top coming?
- DAX & S&P 500 both nearing very important crossroads
- EUR/USD long-term trend resumption risk is very real
Hot off the press - See the DailyFX Q3 Forecasts for our fundamental and technical viewpoints on major currencies and markets.
Gold could be on verge of a strong move; crude oil, is there a top coming?
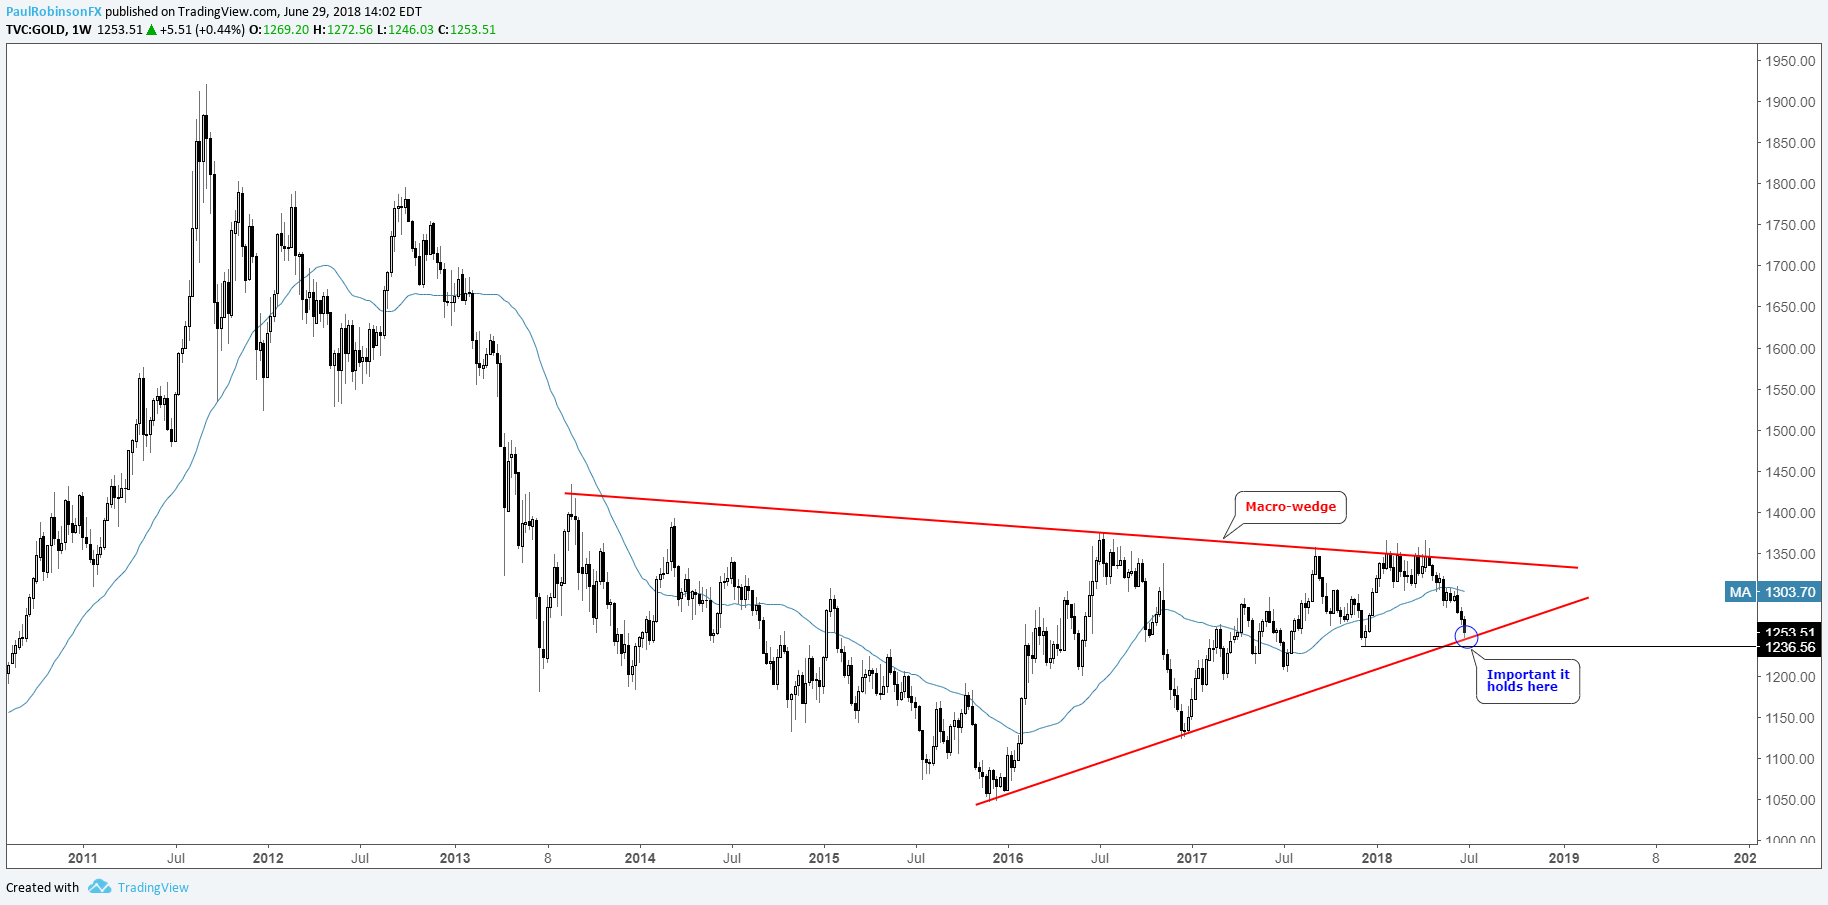
Last month, gold finally caught some momentum after breaking free from the range which kept it confined for the first few months of the year. The downdraft has the important December 2015 trend-line and December low in play.
The trend-line also makes up the bottom-side of a developing long-term wedge. Ideally, for the pattern to become more explosive (in either direction), a bounce develops so price can work a little closer to the apex of the formation. However, if the trend-line gives-way, we will continue to build on an already bearish bias.
Gold Weekly Chart (Bottom of macro-wedge in play)
For more in-depth analysis (fundamental/technical), check out the Q3 Forecast for Gold
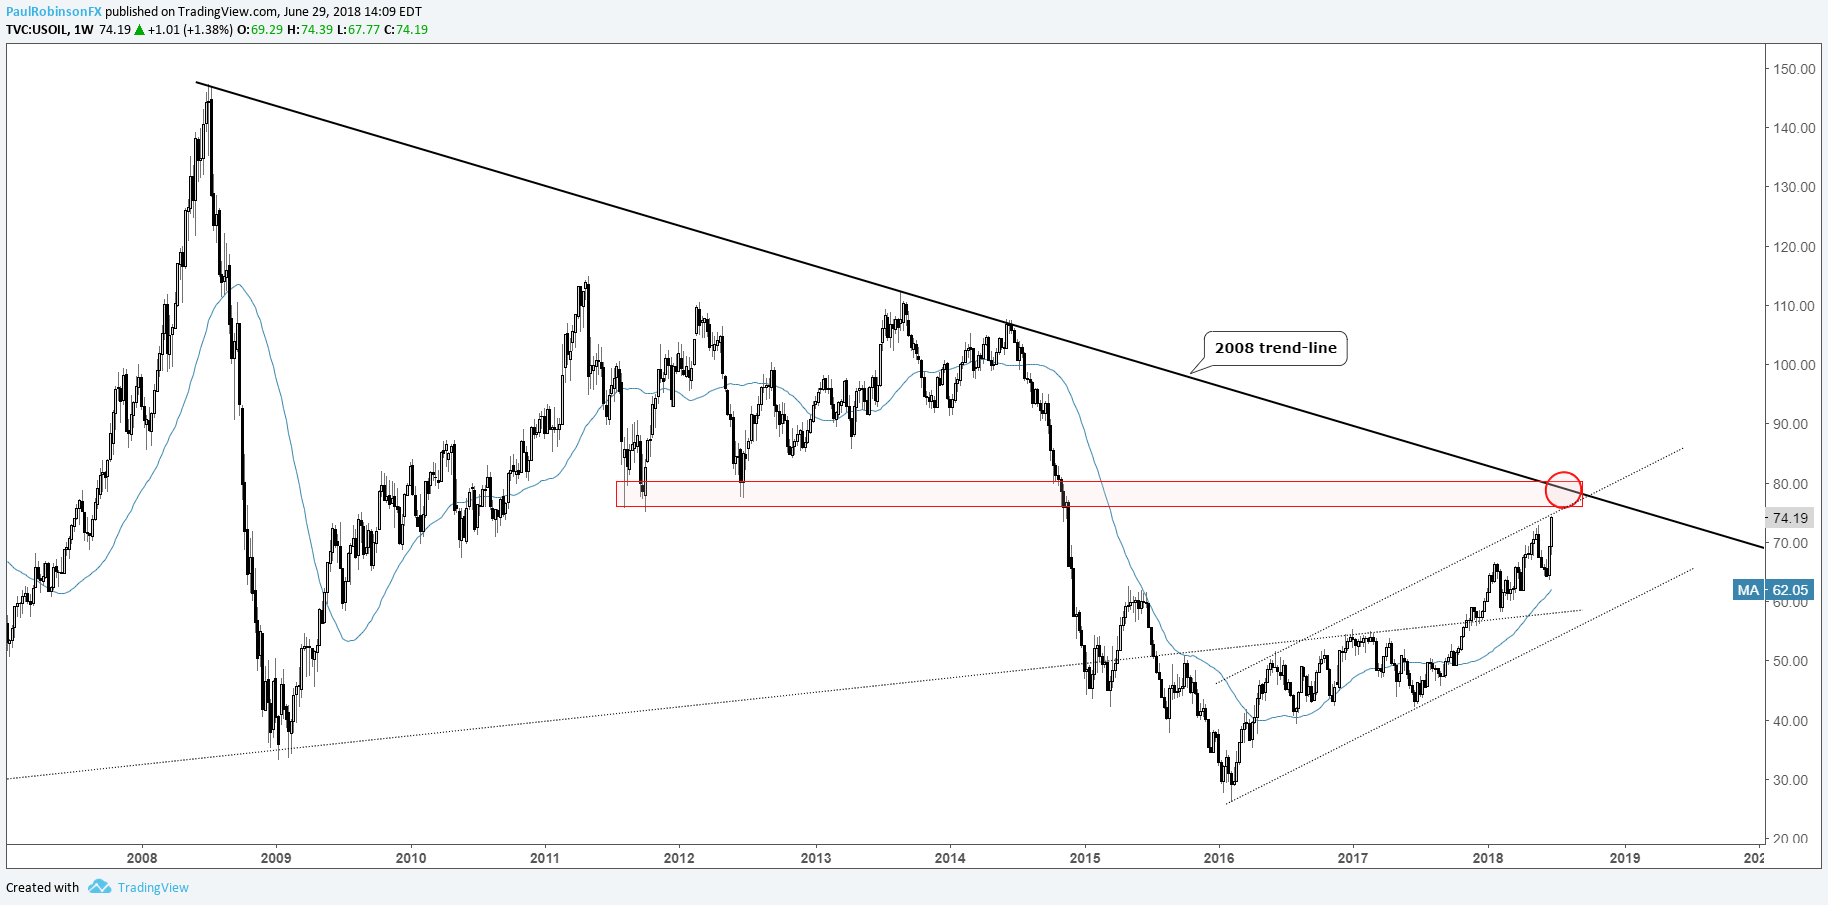
Crude oil has been an incredibly strong market, demonstrating far more strength than this market participant thought we would see. As we head into a fresh month/quarter, oil looks on the verge of more strength, but we may very well be nearing a major roadblock for the drive higher.
The trend-line running down off the 2008 high passing over peaks in 2013 and 2014 is likely to prove at least temporarily problematic on a first test (there is price resistance in the area too). Should we see bearish price action develop around the trend-line, we will certainly take note and try to drill down to a specific set-up. But until then, the trend is too strong too fight.
Crude Oil Weekly Chart (2008 trend-line)
For more in-depth analysis (fundamental/technical), check out the Q3 Forecast for Crude Oil
DAX & S&P 500 both nearing very important crossroads
The DAX is in the process of carving out a massive head-and-shoulders pattern, with its beginnings extending back to June of last year. The sheer size and duration of the formation points to a very large decline should we see a break of the neckline.
The measured move target, based on the height of the formation subtracted from the neckline, points to a decline to around 10k, but looking for support on a break of the trend-line from 2011, we have to look closer to 9k. Down there lies the lower parallel of the bull-market (2009-current) and lows from 2016.
Remember – An H&S formation is not validated until it breaks the neckline, so even though the pattern is very near completion, the neckline is to be treated as support. Furthermore, once a break develops a bounce may soon unfold at the 2011 trend-line, but this support line isn’t viewed as enough to keep the forces of the broader top from being fully exerted.
The lining up of the neckline with where the S&P 500 is in proximity to its own major support, suggests the two major supports, if to be broken, will happen right around the same time. This will reinforce the notion we see assets across the risk spectrum respond to an increase in uncertainty and volatility.
DAX Weekly Chart ('Head-and-shoulders')

As discussed on Thursday, the U.S. market is dangerously close to driving off a cliff. A fourth, and perhaps final, test of the Feb 2016 trend-line/200-day MA combo is viewed as highly vulnerable to failing. (For more on why a 4th test of this particular confluent support is so important, see Thursday’s S&P 500/Dow commentary).
A failure is likely to have the S&P 500 reeling below support levels carved out earlier in the year, and with it a full-on risk-off trade affecting all financial markets. But until it breaks we must give support the benefit of the doubt...
S&P 500 Daily Chart (Big Test Nearing)

For more in-depth analysis (fundamental/technical), check out the Q3 Forecast for Global Equity Indices
EUR/USD long-term trend resumption risk is very real
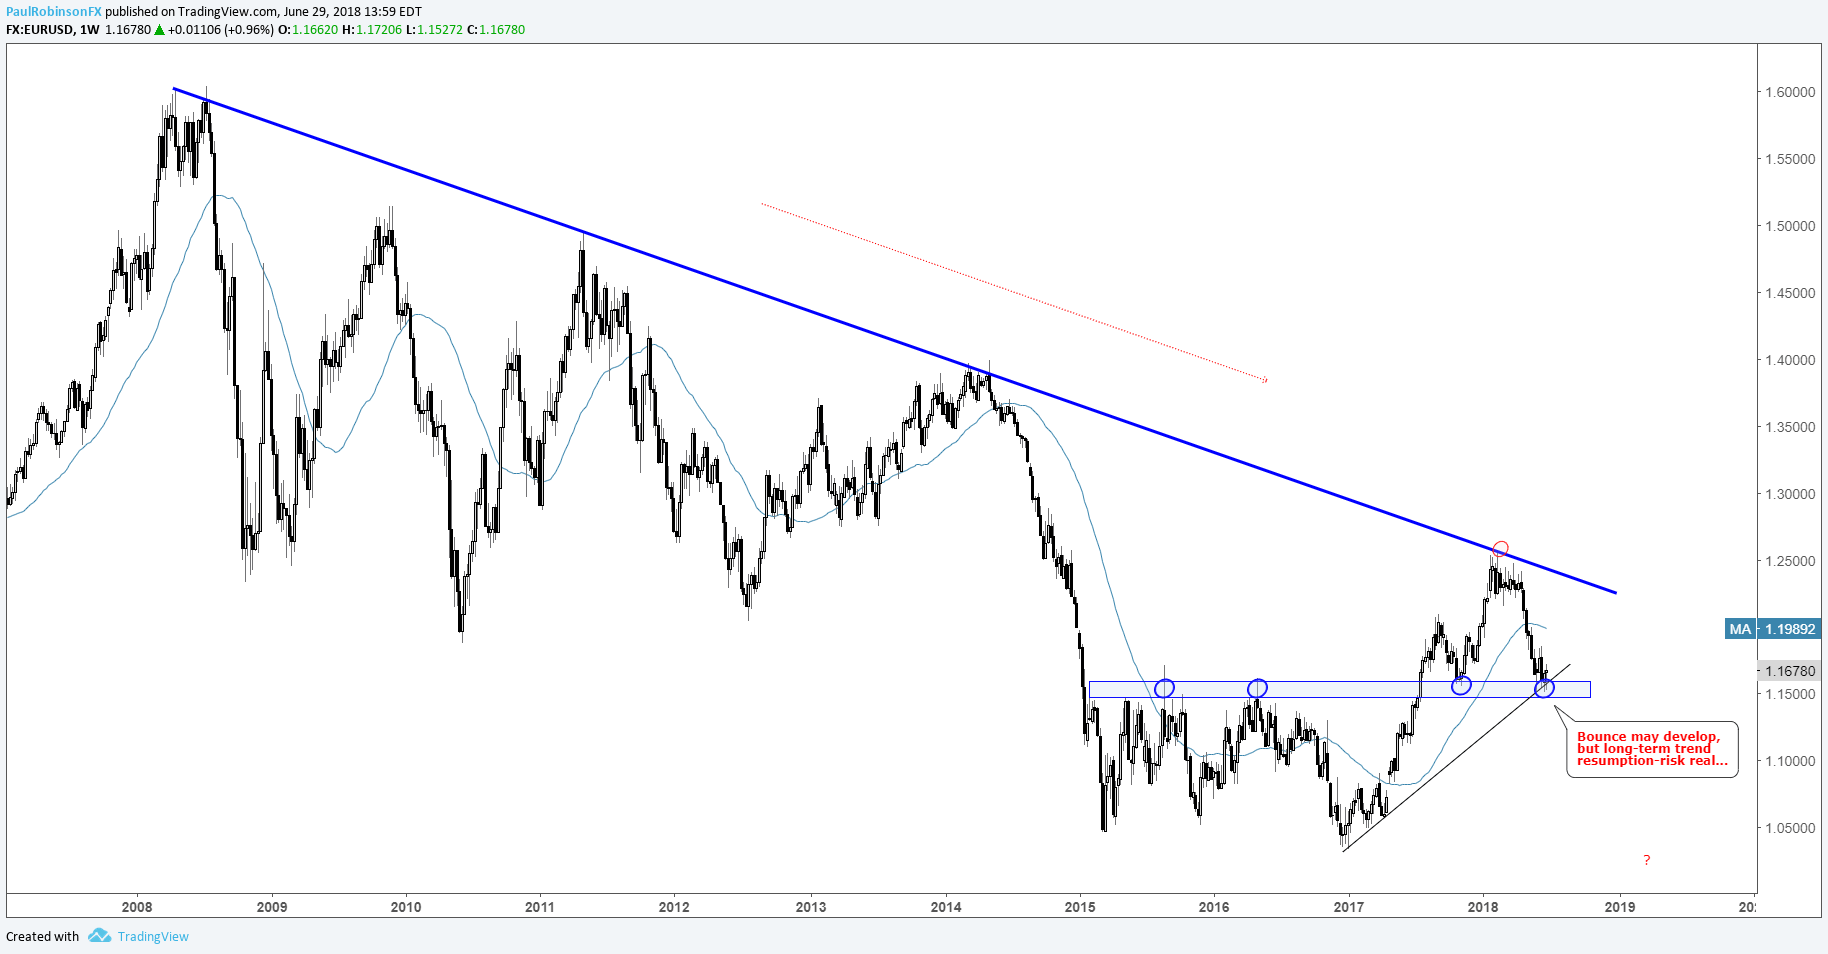
The decline in the euro has in play big support around the 11500-line, which makes up the top of the range carved out during 2015/16. In the near-term, this is keeping EUR/USD buoyed, and perhaps a bounce may even develop in the weeks ahead. However, the turn down from the 2008 trend-line may have proven to kick off the next big leg lower in the downtrend dating back a decade.
A bounce may develop first here, but a weekly close under 11400 will firmly put the euro below major support and at risk of seeing much lower levels as the long-term trend reasserts itself. It is quite possible we see at some point this year the filling of the April 2017 French-election induced gap at 10724.
EUR/USD Weekly Chart (Downtrend meets support)
For more in-depth analysis (fundamental/technical), check out the Q3 Forecast for EUR/USD
Helpful Resources
Whether you are a new or experienced trader, we have several resources available to help you; indicator for tracking trader sentiment, quarterly trading forecasts, analytical and educational webinars held daily, trading guides to help you improve trading performance, and one specifically for those who are new to forex.
---Written by Paul Robinson, Market Analyst
You can follow Paul on Twitter at @PaulRobinsonFX


