


Talking Points:
- It’s been a rocky past couple of weeks for US stocks, as selling pressure has remained in the Dow ever since the Fed’s rate hike earlier in June. With a hawkish FOMC appearing set for two more rate hikes in the second half of the year along with another three in 2019, will traders continue to temper risk tolerance as tighter monetary conditions are on the horizon for the United States?
- Dow price action is fast approaching a trend-line that’s taken from prior 2018 higher-lows set in February, April and again in May. This offers an interesting area of support potential as we trade into Q3, but if this trend-line can’t hold up a fourth test, the February low is exposed and a break-below that area could usher in longer-term bearish prospects in the blue chip index.
- DailyFX Forecasts are available from the DailyFX Trading Guides page. If you’re looking to improve your trading approach, check out Traits of Successful Traders. And if you’re looking for an introductory primer to the Forex market, check out our New to FX Guide.
Do you want to see how retail traders are currently trading the US Dollar? Check out our IG Client Sentiment Indicator.
Dow Strength Dissipates as Sellers Fade Yesterday’s Strength
Yesterday saw a strong bid develop across American indices as the US session got underway, and the Dow Jones Industrial Average surged by as much as 475 points off of the June lows. Prices quickly posed a re-test of the 23.6% Fibonacci retracement of the post-Election move, but starting around mid-day, sellers came back in and re-grasped control of price action. The Dow dove towards June lows by the end of the session, and after Dow futures meandered back-and-forth overnight, prices are driving to fresh lows Seven-week lows ahead of this morning’s US Open.
Dow Jones Hourly Chart: Yesterday’s Strength Soundly Faded, Price Action to Fresh Lows

Chart prepared by James Stanley
At this point, we’re a couple of days away from the end of Q2, and prices in the Dow are at Seven-week lows. We’d previously looked at the prospect of bearish breakouts in the Dow should the prior zone of support that runs from 24,384-24,522 not hold, and the initial target was at 24,144, which is the 61.8% retracement of the April-June bullish move. There is one additional down-side target for that setup, and that’s at the 76.4% retracement that’s confluent with another interesting element of support: A trend-line can be found by connecting the February, April and May lows, and that trend-line projects to the approximate area of that 76.4% Fibonacci retracement.
Dow Jones Daily Chart: Fast Approaching Confluence with Trend-Line Support From 2018 Lows
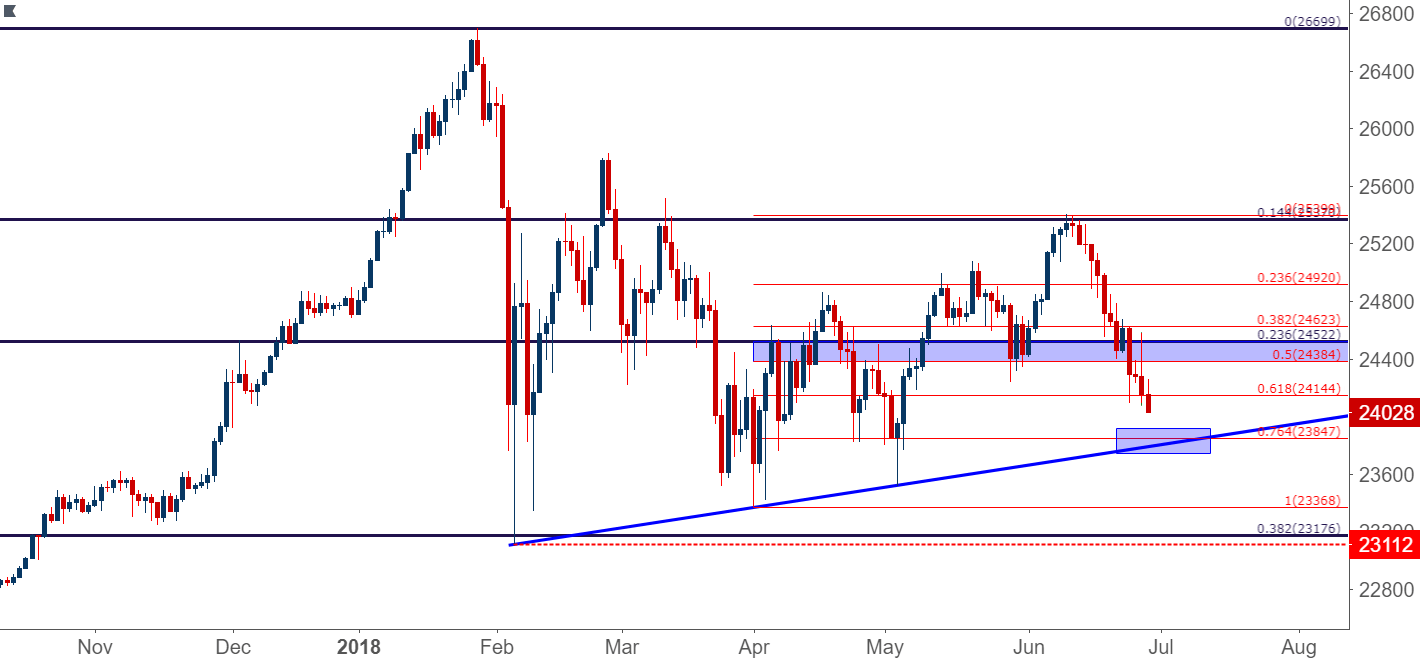
Chart prepared by James Stanley
The big question at this point is whether that trend-line will bring a fourth bounce, as we’ve already seen inflections in February, April and then again in early-May. At the very least, this could be an area to get a bit more cautious with short-side continuation; and if we do see support starting to show, the door could then re-open to bullish strategies in the Dow. This could be an ideal theme to track as we open into Q3 but, it should be noted, this would be playing a reversal of what’s become rather directional one-sided momentum since the bearish move off of the 14.4% Fibonacci retracement two weeks ago.
On a longer-term basis, the bias in US equities does remain bullish, even despite the past three weeks of pain. A break below the 38.2% retracement of the post-Election move, the same area that helped to cauterize the lows in February, could change that equation but, until then, this is what the chart is giving us, and support potential remains on that confluent area around the projection of the 2018 bullish trend-line.
Dow Weekly Chart
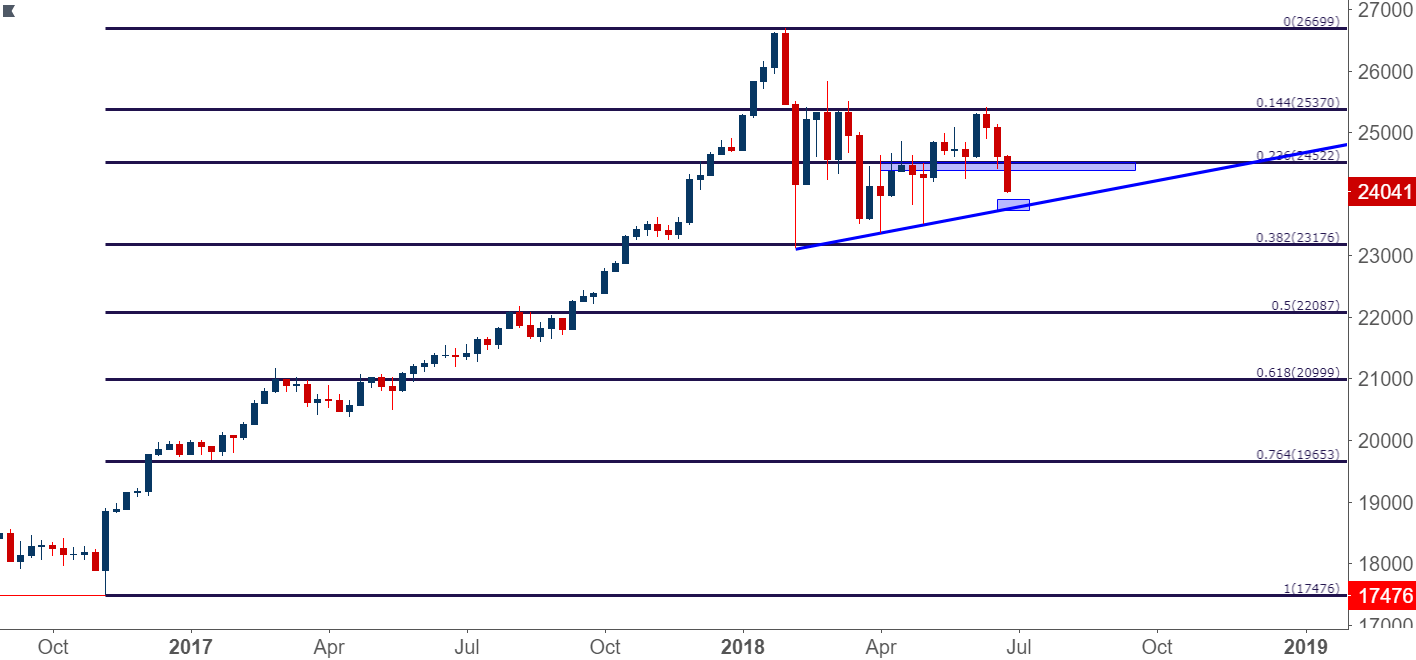
Chart prepared by James Stanley
To read more:
Are you looking for longer-term analysis on the U.S. Dollar? Our DailyFX Forecasts for Q1 have a section for each major currency, and we also offer a plethora of resources on USD-pairs such as EUR/USD, GBP/USD, USD/JPY, AUD/USD. Traders can also stay up with near-term positioning via our IG Client Sentiment Indicator.
Forex Trading Resources
DailyFX offers a plethora of tools, indicators and resources to help traders. For those looking for trading ideas, our IG Client Sentiment shows the positioning of retail traders with actual live trades and positions. Our trading guides bring our DailyFX Quarterly Forecasts and our Top Trading Opportunities; and our real-time news feed has intra-day interactions from the DailyFX team. And if you’re looking for real-time analysis, our DailyFX Webinars offer numerous sessions each week in which you can see how and why we’re looking at what we’re looking at.
If you’re looking for educational information, our New to FX guide is there to help new(er) traders while our Traits of Successful Traders research is built to help sharpen the skill set by focusing on risk and trade management.
--- Written by James Stanley, Strategist for DailyFX.com
Contact and follow James on Twitter: @JStanleyFX


