


The multi-week rally in the crypto-space has been aggressive, with Ethereum leading the charge higher. We’ve maintained that broadly speaking the group still faces big headwinds from the perspective of a sector still suffering from speculative excesses despite the massive declines already experienced.
A floor may have been put in (although that seems very much up in the air), but it’s unlikely the market has been flushed enough to put together another major bull run. Looking at the shorter-term, risk of a pullback is elevated – Bitcoin, Ripple, and Ethereum are in focus.
See how positioning changes in cryptocurrencies and other markets can help as a tool to determine price direction on the IG Client Sentiment page.
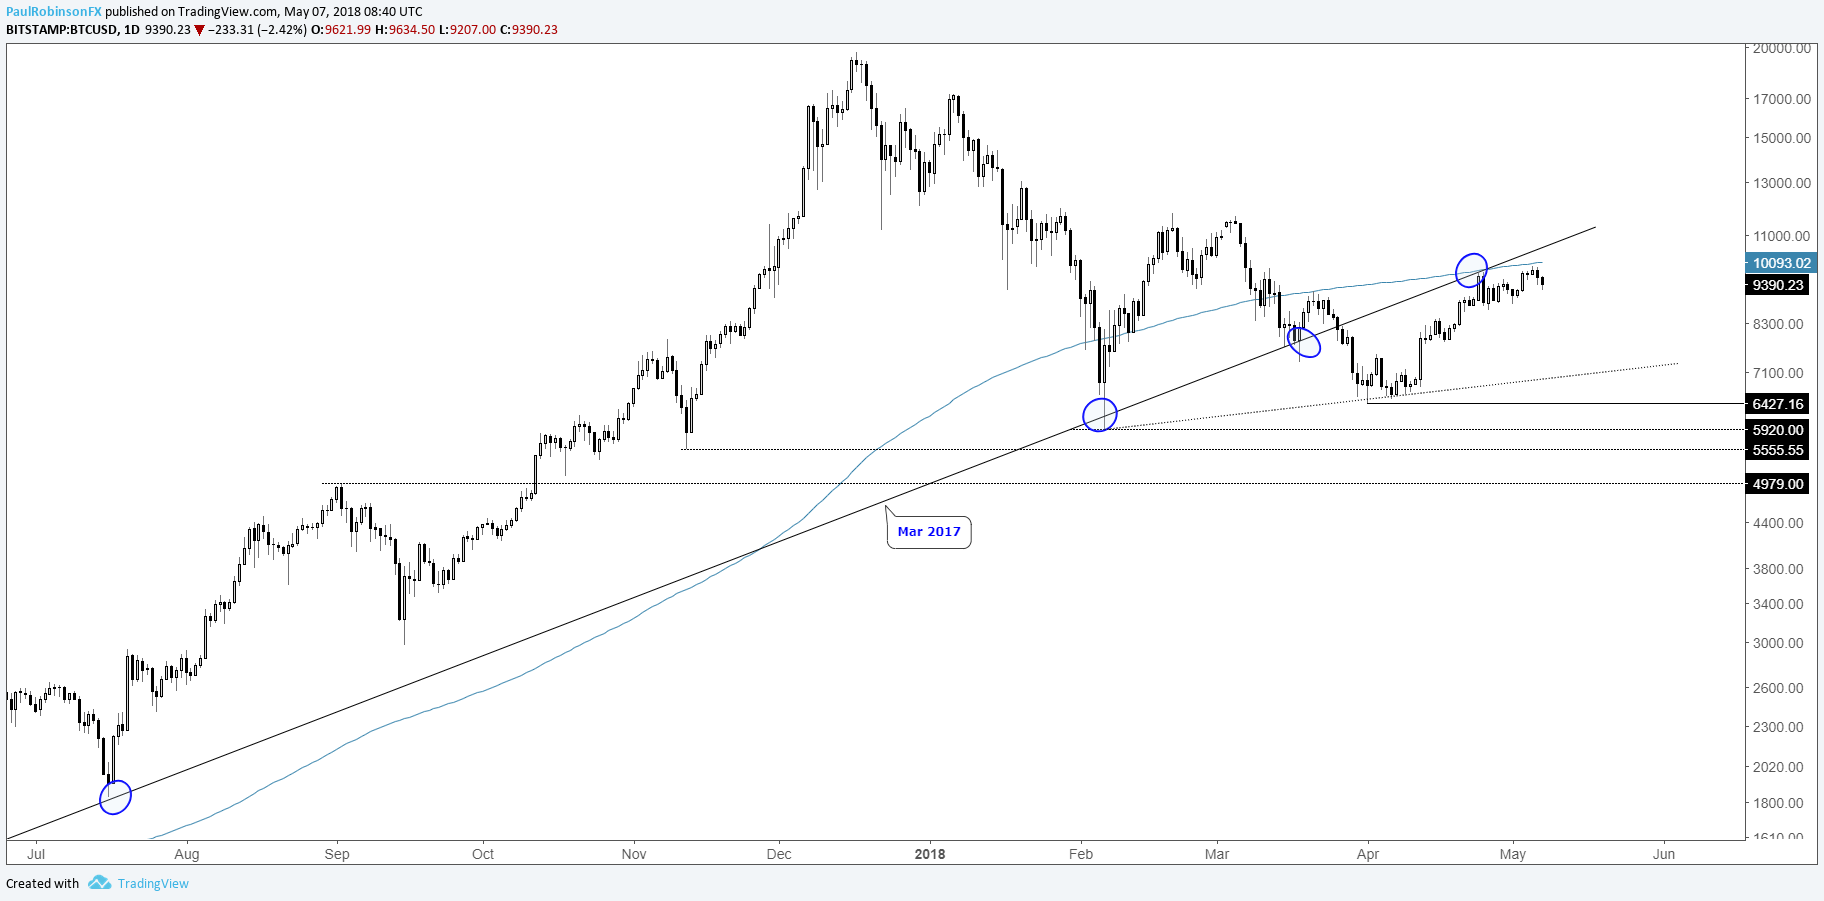
Bitcoin has underside trend-line resistance
The grind higher in Bitcoin was recently capped by confluence between the underside of the March 2017 trend-line and 200-day MA. The advance has been somewhat tepid in terms of momentum, but that doesn’t mean it can’t continue. However, at this time with the bottom-side of the longer-term trend-line remaining in the way, risk of a pullback, at the least, is elevated.
Check out this guide to learn more about how to trade Bitcoin and other cryptocurrencies.
BTC/USD Daily Chart (Underside t-line resistance)
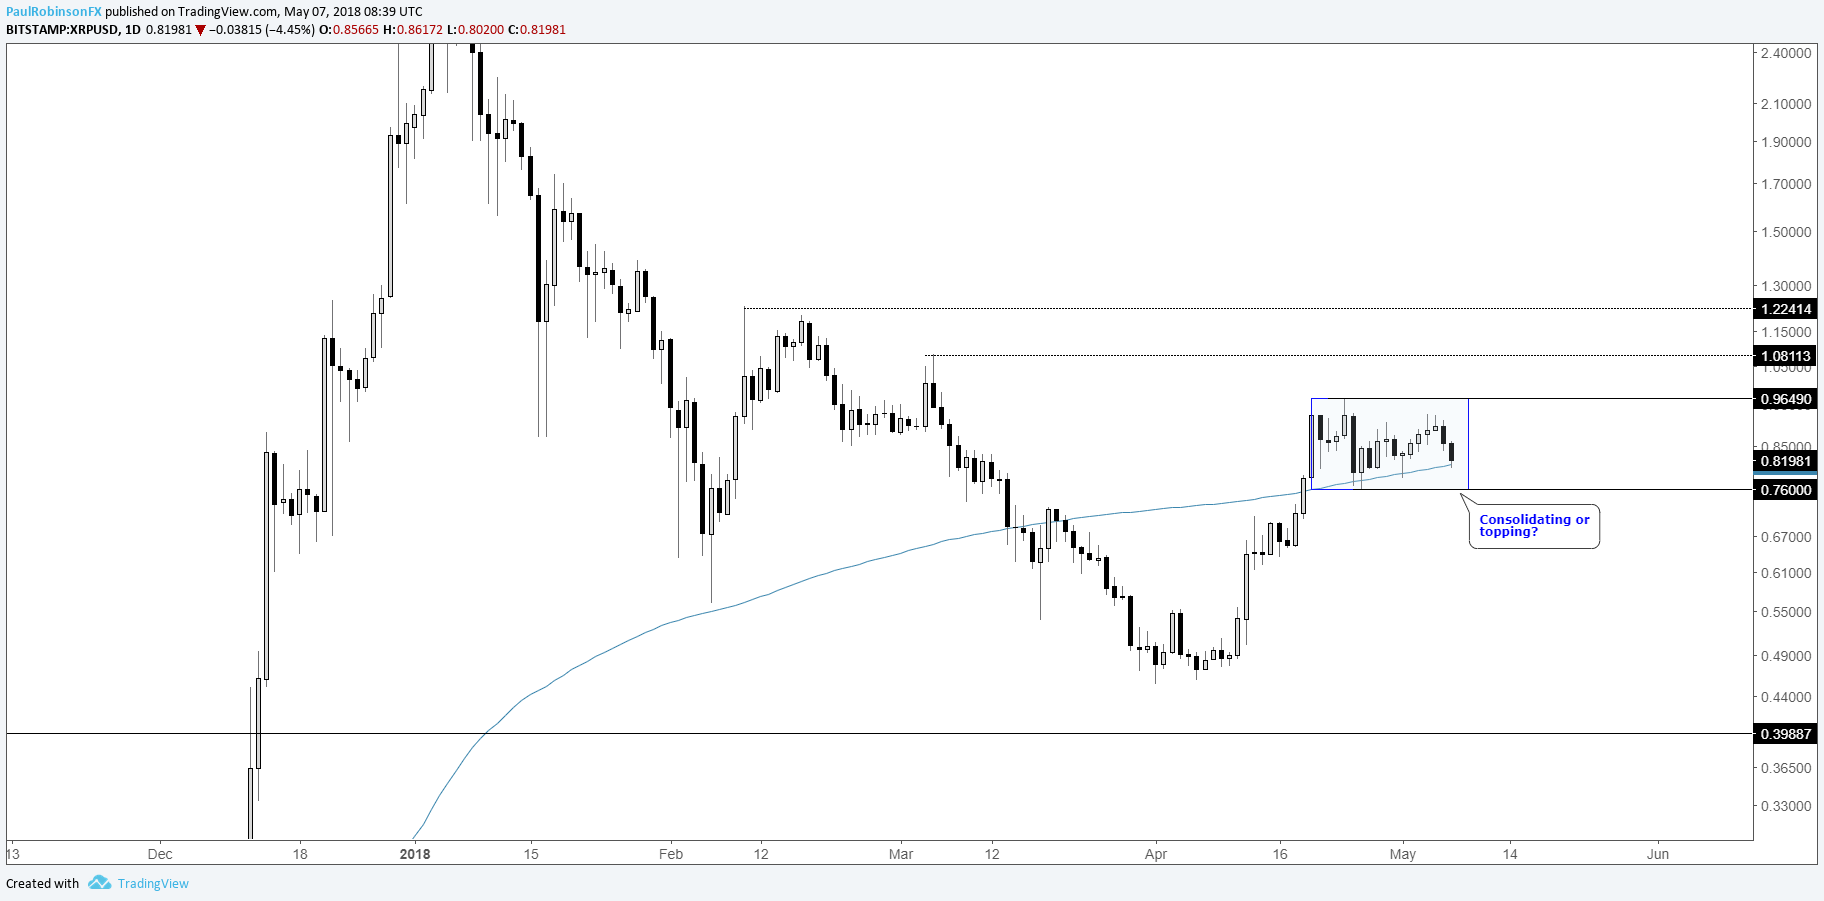
Ripple consolidating on 200-day or rolling over?
The price action in Ripple could be working towards a consolidation resulting in higher prices, or it could be on the verge of rolling over. Keeping XRP supported, is the 200-day MA running up under a pair of small daily swing lows (4/26, 5/1). Today, the MA is being tested again. A break below and 7600 will likely have Ripple rolling downhill, while a hold and eventual break above 9649 could garner more interest to the 10900/2200-area.
XRP/USD Daily Chart (Sitting on 200-day)
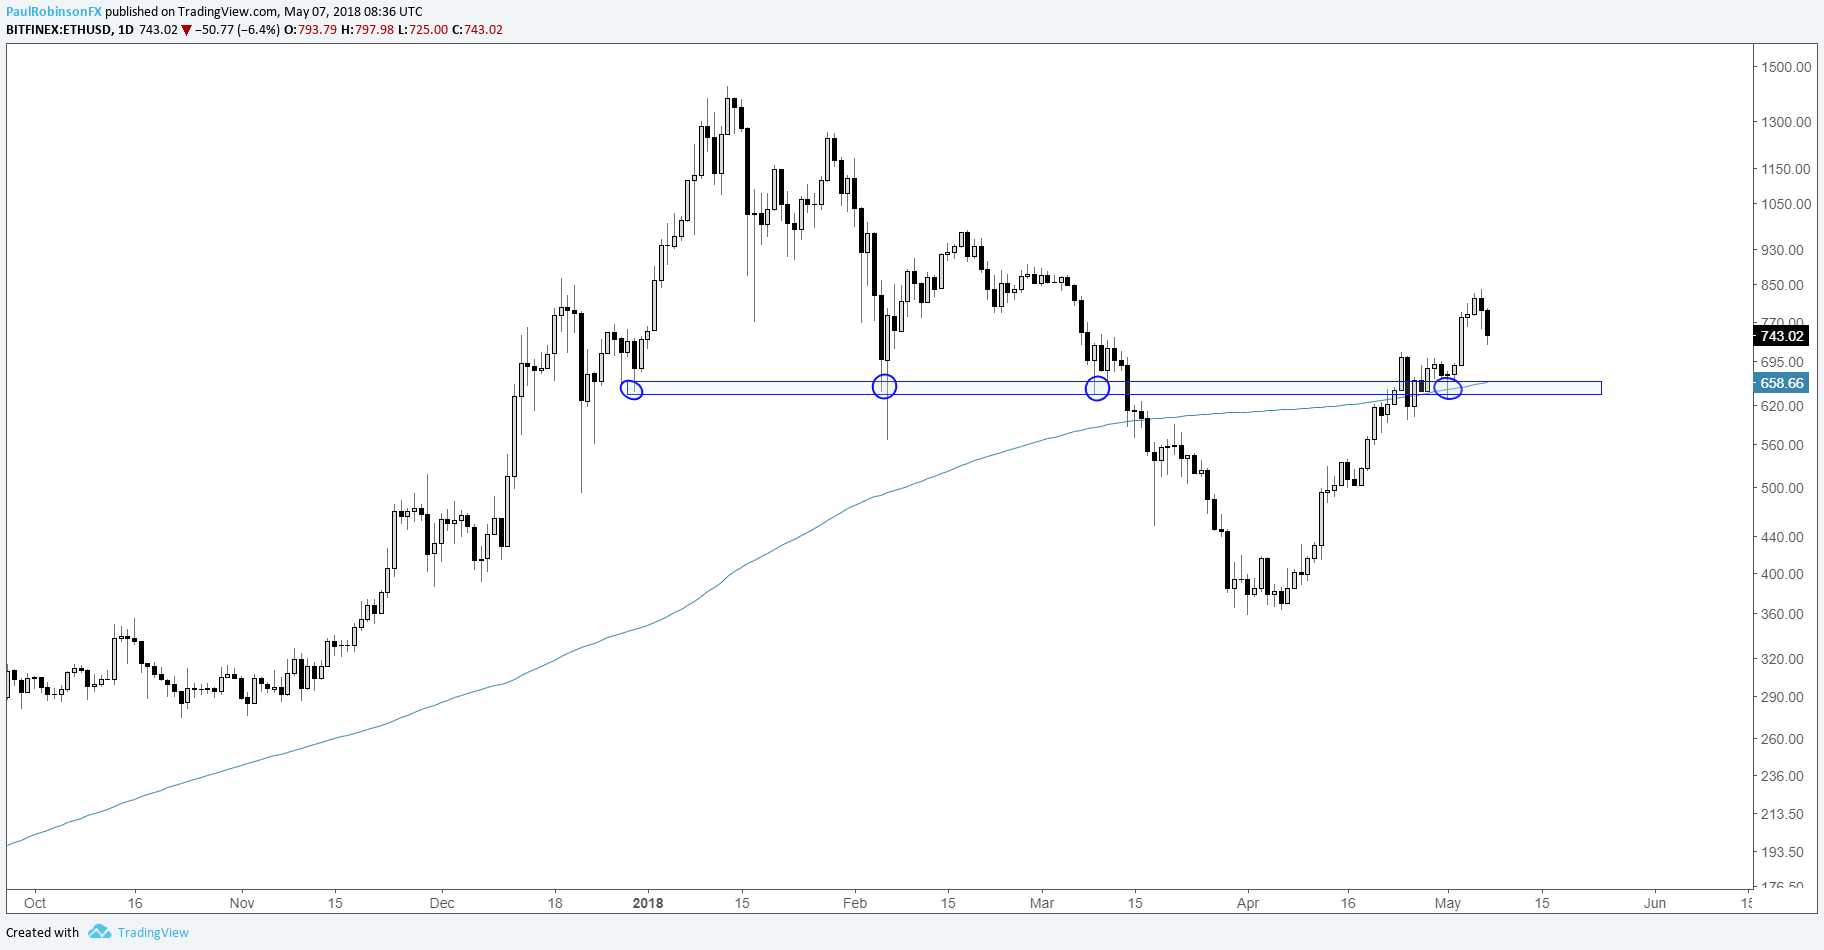
Ethereum strongest, support test may soon be in store
The Ethereum rally has been quite impressive, taking back a large swath of its losses from earlier in the year. The current pullback is to be expected given the run; what we’ll be watching is support down around 650 where not only does price support lie, but the 200-day MA as well. A hold there may offer would-be longs an attractive spot to enter.
ETH/USD Daily Chart (Support below)
Helpful Resources for Cryptocurrency Traders
Whether you’re a new or experienced cryptocurrency trader, we have several resources to help you;Introduction to bitcoin trading guide, indicator for tracking trader sentiment, and a weekly webinar discussing the latest developments.
---Written by Paul Robinson, Market Analyst
To receive Paul’s analysis directly via email, please SIGN UP HERE
You can follow Paul on Twitter at @PaulRobinsonFX


