


In the past week, the cryptocurrency space has experienced a sizable bounce, but given where the group is in the cycle of an unwinding speculative mania, rallies remain likely to fail. Even if many of the key names have found a bottom, which still looks unlikely, a resumption of a strong trend higher will take time as much technical and psychological damage has been done.
Litecoin has thus far lagged behind other major names and is seen as the first to lead the group lower. Bitcoin has a trend-line not far ahead to keep an eye on, could be a capper on any additional upside from here.
See how positioning changes in cryptocurrencies and other markets can help as a tool to determine price direction on the IG Client Sentiment page.
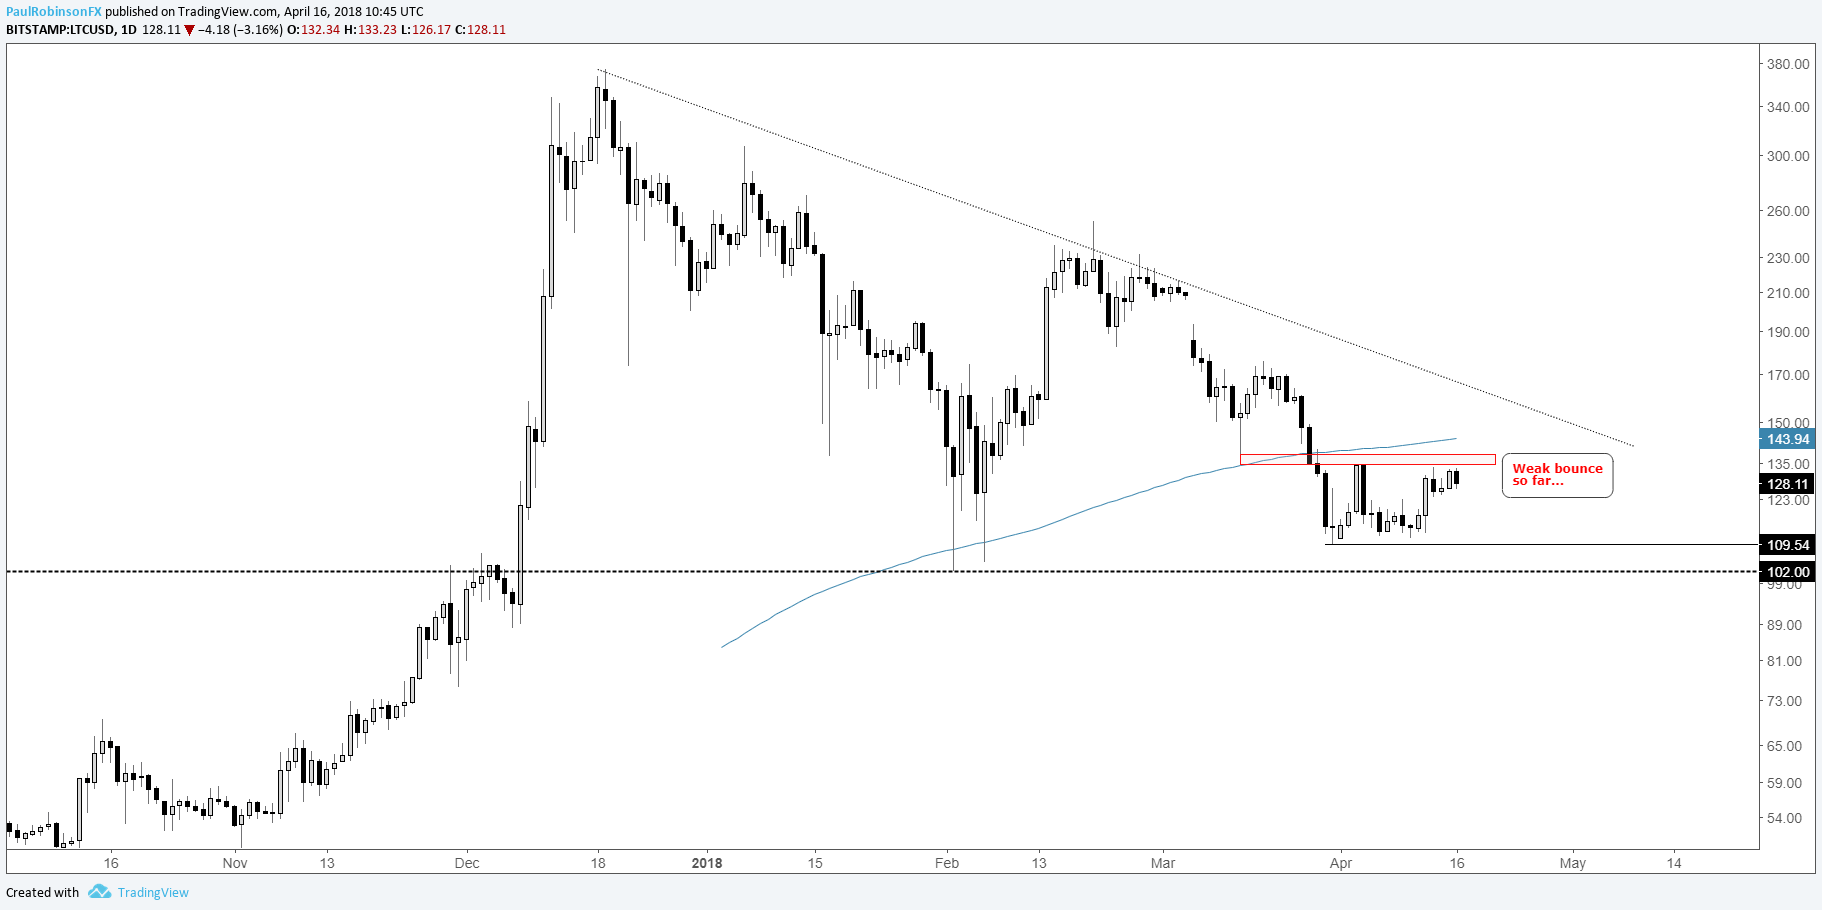
Litecoin remains heavy, targeting 102 or worse on downturn
While other key players in the space have experienced strong rallies (Bitcoin, Ethereum, Ripple…), the same can’t be said for Litecoin. It is struggling to climb above the swing-high created on April 3. If LTC/USD can move above that swing-high it will have the 3/18 swing-low at 127 and the 200-day MA at 144 to contend with.
On another downturn in the group, risk of another lower-low will be elevated. Looking below the recent low at 109.54, the spike-low from February at 102 is viewed as next up as support. A break below there and the psychological level of 100 could see Litecoin reeling even further in the not-too-distant future.
Check out this guide to learn more about how to trade Bitcoin and other cryptocurrencies.
LTC/USD Daily Chart (Weak bounce)
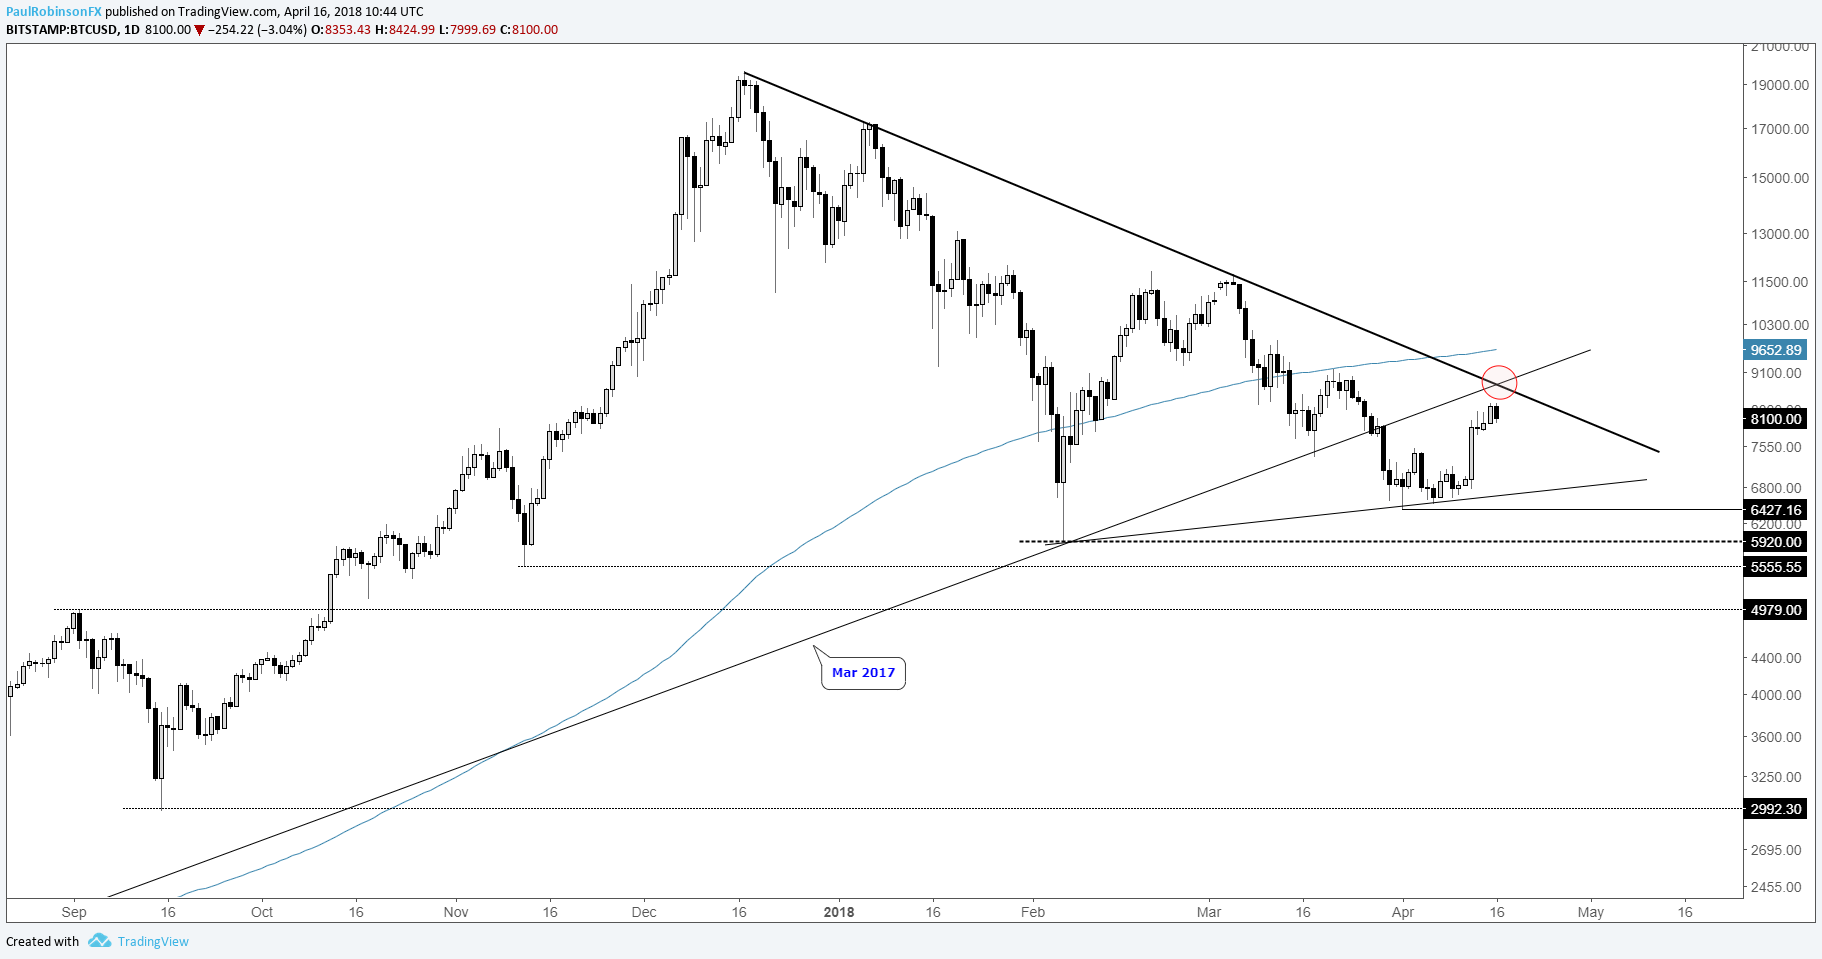
Bitcoin has trend-line resistance not far ahead
During the recent bounce, Bitcoin has been somewhere in the middle as far as strength is concerned. It could still rally a bit further before running out of gas, though, with the trend-line running down off record highs clocking in around 8700.
In the same vicinity, the underside of the previously broken March 2017 trend-line arrives in near confluence. This would be a good spot to look for BTC/USD to find opposition and roll over. Price action could develop into a wedge should it bounce around between the record high trend-line and one starting at the Feb spike-low passing under the recent bottom. But for now, we’ll focus on how Bitcoin reacts to any test of resistance.
BTC/USD Daily Chart (Resistance just ahead)
Helpful Resources for Cryptocurrency Traders
Whether you’re a new or experienced cryptocurrency trader, we have several resources to help you;Introduction to bitcoin trading guide, indicator for tracking trader sentiment, and a weekly webinar discussing the latest developments.
---Written by Paul Robinson, Market Analyst
To receive Paul’s analysis directly via email, please SIGN UP HERE
You can follow Paul on Twitter at @PaulRobinsonFX


